How Memory Allocation Affects Performance in Multithreaded Programs
by Rickey C. Weisner, March 2012
If your application does not scale on new multiprocessor, multicore, multithread hardware, the problem might be lock contention in the memory allocator. Here are the tools to identify the issue and select a better allocator.
Introduction
Your new server has just gone into production. It has multiple sockets, tens of cores, and hundreds of virtual CPUs. You recommended it, you fought for the budget, and you implemented the solution. Now, the server is in production.
But wait—out of the hundreds of threads configured for it, only a handful seem busy. The transaction rate is not even close to what you predicted. The system is only 25% busy. Who do you call? What do you do? Update your resume?
Before you panic, check the application's use of locks! It is challenging to develop efficient, scalable, highly threaded applications. Operating system developers face the same challenge, especially in the functional area of memory allocation.
Terminology
In this article, a socket is a chip, a single piece of CPU hardware. Sockets have cores. A core typically consists of its own integer processing unit and Level 1 (and sometimes Level 2) cache. A hardware thread, strand, or virtual CPU (vCPU) is a set of registers. vCPUs share resources, such as Level 1 cache. Most operating systems report the number of vCPUs as the CPU count.
Background
Once upon a time, programs and operating systems were single-threaded. A program, while running, had access to and control over all the system resources. Applications running on UNIX systems used the malloc() API to allocate memory and the free() API to release the memory.
Calling malloc() not only increased the address space available to the process but also associated random access memory (RAM) with the address space. The advent of demand-paged operating systems changed all that. Calling malloc() still grew the address available to the application, but the RAM was not allocated until the page was touched. The sbrk() and brk() APIs were used to grow the address space available to the application.
It is a common misconception that free() reduces the program size (address space). Although the address space provided by sbrk()/brk() can be shrunk by passing a negative value to sbrk(), as a practical matter, free() does not implement that technique because it would necessitate reducing address space in the same order in which it was allocated.
Normally, RAM associated with the address space is returned to the kernel when a low amount of free memory causes the page scanner to run or the application exits. This is where memory-mapped files enter the picture. The ability to map a file into a program's address space provides a second method of growing address space. A significant difference is that when memory-mapped files are unmapped, the RAM associated with the unmapped address range is returned to the kernel and the total address space of the process decreases.
Multicore hardware systems led to multithreaded operating systems and multithreaded applications. Then, more than one component of a program potentially needed to grow address space simultaneously. Some method of synchronizing these activities was needed.
Initially, a single-process lock was used to ensure single-thread access to the protected regions in malloc() and free() in libc. The single lock actually works reasonably well for applications with low thread counts or applications that make infrequent use of the malloc() and free() APIs. But highly threaded applications running on systems with a large number of CPUs can run into scalability issues, reducing expected transaction rates due to contention for the malloc and free lock.
How to Recognize the Problem
By default, most UNIX operating systems use the version of malloc() or free() that resides in libc. In Oracle Solaris, malloc() and free() access is controlled by a per-process lock. In Oracle Solaris, the first tool to use to determine whether there is lock contention is prstat(1M) with the -mL flags and a sampling interval of 1.
Here is the prstat output for an application using two threads. One thread is calling malloc(), and the other is calling free().
PID USERNAME  USR SYS TRP TFL DFL  <strong>LCK</strong> SLP LAT VCX ICX SCL SIG PROCESS/LWPID

 4050 root     100 0.0 0.0 0.0  0.0 <strong>0.0</strong> 0.0 0.0  0   51  0   0   malloc_test/2
 4050 root      97 3.0 0.0 0.0  0.0 <strong>0.0</strong> 0.0 0.0  0   53 8K   0   malloc_test/3
The prstat output provides a row of information for each thread in the process. Please see the man page for a description of each column. Of interest to us here is the LCK column, which reflects the percentage of time the thread spent waiting for a user-level lock during the last sampling period. Listing 1 shows the output for the same application using 8 threads.
Listing 1. prstat Output for Eight Threads
PID USERNAME USR SYS TRP TFL DFL <strong>LCK</strong> SLP LAT VCX ICX SCL SIG PROCESS/LWPID

 4054 root     100 0.0 0.0 0.0 0.0 <strong>0.0</strong> 0.0 0.0  0   52 25  0   malloc_test/8
 4054 root     100 0.0 0.0 0.0 0.0 <strong>0.0</strong> 0.0 0.0  0   52 23  0   malloc_test/7
 4054 root     100 0.0 0.0 0.0 0.0 <strong>0.0</strong> 0.0 0.0  0   54 26  0   malloc_test/6
 4054 root     100 0.0 0.0 0.0 0.0 <strong>0.0</strong> 0.0 0.0  0   51 25  0   malloc_test/9
 4054 root      94 0.0 0.0 0.0 0.0 <strong>5.5</strong> 0.0 0.0 23   51 23  0   malloc_test/3
 4054 root      94 0.0 0.0 0.0 0.0 <strong>5.6</strong> 0.0 0.0 25   48 25  0   malloc_test/4
 4054 root      94 0.0 0.0 0.0 0.0 <strong>6.3</strong> 0.0 0.0 26   49 26  0   malloc_test/2
 4054 root      93 0.0 0.0 0.0 0.0 <strong>6.7</strong> 0.0 0.0 25   50 25  0   malloc_test/5
With 8 threads, we are beginning to see some lock contention. Listing 2 shows the output for 16 threads.
Listing 2. prstat Output for Sixteen Threads
PID USERNAME USR SYS TRP TFL DFL <strong>LCK</strong> SLP LAT VCX ICX SCL SIG PROCESS/LWPID

 4065 root      63  37 0.0 0.0 0.0 <strong>0.0</strong> 0.0 0.0 51 222 .4M  0   malloc_test/31
 4065 root      72  26 0.0 0.0 0.0 <strong>1.8</strong> 0.0 0.0 42 219 .3M  0   malloc_test/21
 4065 root      66  30 0.0 0.0 0.0 <strong>4.1</strong> 0.0 0.0 47 216 .4M  0   malloc_test/27
 4065 root      74  22 0.0 0.0 0.0 <strong>4.2</strong> 0.0 0.0 28 228 .3M  0   malloc_test/23
 4065 root      71  13 0.0 0.0 0.0  <strong>15</strong> 0.0 0.0 11 210 .1M  0   malloc_test/30
 4065 root      65 9.0 0.0 0.0 0.0  <strong>26</strong> 0.0 0.0 10 186 .1M  0   malloc_test/33
 4065 root      37  28 0.0 0.0 0.0  <strong>35</strong> 0.0 0.0 36 146 .3M  0   malloc_test/18
 4065 root      38  27 0.0 0.0 0.0  <strong>35</strong> 0.0 0.0 35 139 .3M  0   malloc_test/22
 4065 root      58 0.0 0.0 0.0 0.0  <strong>42</strong> 0.0 0.0 28 148  40  0   malloc_test/2
 4065 root      57 0.0 0.0 0.0 0.0  <strong>43</strong> 0.0 0.0  5 148  14  0   malloc_test/3
 4065 root      37 8.1 0.0 0.0 0.0  <strong>55</strong> 0.0 0.0 12 112 .1M  0   malloc_test/32
 4065 root      41 0.0 0.0 0.0 0.0  <strong>59</strong> 0.0 0.0 40 108  44  0   malloc_test/13
 4065 root      23  15 0.0 0.0 0.0  <strong>62</strong> 0.0 0.0 23  88 .1M  0   malloc_test/29
 4065 root      33 2.9 0.0 0.0 0.0  <strong>64</strong> 0.0 0.0  7  91 38K  0   malloc_test/24
 4065 root      33 0.0 0.0 0.0 0.0  <strong>67</strong> 0.0 0.0 42  84  51  0   malloc_test/12
 4065 root      32 0.0 0.0 0.0 0.0  <strong>68</strong> 0.0 0.0  1  82   2  0   malloc_test/14
 4065 root      29 0.0 0.0 0.0 0.0  <strong>71</strong> 0.0 0.0  5  78  10  0   malloc_test/8
 4065 root      27 0.0 0.0 0.0 0.0  <strong>73</strong> 0.0 0.0  5  72   7  0   malloc_test/16
 4065 root      18 0.0 0.0 0.0 0.0  <strong>82</strong> 0.0 0.0  3  50   6  0   malloc_test/4
 4065 root     2.7 0.0 0.0 0.0 0.0  <strong>97</strong> 0.0 0.0  7   9  18  0   malloc_test/11
 4065 root     2.2 0.0 0.0 0.0 0.0  <strong>98</strong> 0.0 0.0  3   7   5  0   malloc_test/17
With 2 threads and 8 threads, the process was spending most of its time processing. But with 16 threads, we see some threads spending most of their time waiting for a lock. But which lock? For the answer to that question, we use an Oracle Solaris DTrace tool, plockstat(1M). We are interested in contention events (-C). We will monitor for 10 seconds (-e 10) an already running process (-p).
plockstat -C -e 10 -p `pgrep malloc_test`

0
Mutex block
Count  nsec    Lock                        Caller
  72 306257200 libc.so.1`libc_malloc_lock  malloc_test`malloc_thread+0x6e8
  64 321494102 libc.so.1`libc_malloc_lock  malloc_test`free_thread+0x70c
The first zero comes from the spin count. (Unfortunately, there is a bug in Oracle Solaris 10 that prevents an accurate spin count determination. This bug is fixed in Oracle Solaris 11.)
We see a count (Count) of how many times a thread was blocked and the average time (nsec) in nanoseconds that each block occurred. If the lock has a name (Lock), it is printed as well as the stack pointer (Caller) for when the block occurred. So, 136 times we waited for 3 tenths of a second to get the same lock, which is a performance killer.
The advent of 64-bit highly threaded applications running on tens, if not hundreds, of cores resulted in a clear need for a multithread-aware memory allocator. By design, Oracle Solaris ships with two MT-hot memory allocators, mtmalloc and libumem. There is also a well-known, publicly available MT-hot allocator named Hoard.
Hoard
Hoard was written by Professor Emery Berger. It is in commercial use at numerous well-known companies.
Hoard seeks to provide speed and scalability, avoid false sharing, and provide low fragmentation. False sharing occurs when threads on different processors inadvertently share cache lines. False sharing impairs efficient use of the cache, which negatively affects performance. Fragmentation occurs when the actual memory consumption by a process exceeds the real memory needs of the application. You can think of fragmentation as wasted address space or a sort of memory leak. This can occur when a per-thread pool has address space for an allocation but another thread cannot use it.
Hoard maintains per-thread heaps and one global heap. The dynamic allocation of address space between the two types of heap allows Hoard to reduce or prevent fragmentation, and it allows threads to reuse address space initially allocated by a different thread.
A hash algorithm based on thread IDs maps threads to heaps. The individual heaps are arranged as a series of superblocks, where each is a multiple of the system page size. Allocations larger than half a superblock are allocated using mmap() and unmapped using munmap().
Each superblock houses allocations of a uniform size. Empty superblocks are reused and can be assigned to a new class. This feature reduces fragmentation. (See Hoard: A Scalable Memory Allocator for Multithreaded Applications for more information.)
The Hoard version used for this paper is 3.8. In Hoard.h, there is the following definition:
#define SUPERBLOCK_SIZE 65536 .SUPERBLOCK_SIZE is the size of the superblocks. Any allocation bigger than one half of a superblock or 32 KB will, therefore, use mmap().

Figure 1. Hoard Simplified Architecture
The mtmalloc Memory Allocator
Like Hoard, mtmalloc maintains semi-private heaps and a global heap. With mtmalloc, buckets are created for twice the number of CPUs. The thread ID is used to index into a bucket. Each bucket contains a linked list of caches. Each cache contains allocations of a certain size. Each allocation is rounded up to a power of two allocation. For example, a 100-byte request will be padded to 128 bytes and come out of the 128-byte cache.
Each cache is a linked list of chunks. When a cache runs out of free space, sbrk() is called to allocate a new chunk. The size of a chunk is tunable. Allocations greater than a threshold (64k) are allocated from the global oversize bucket.
There are locks for each bucket and locks for each cache. There is also a lock for the oversize allocation.

Figure 2. mtmalloc Simplified Architecture
The libumem Memory Allocator
libumem is the user-land implementation of the slab allocator introduced in SunOS 5.4. (See The Slab Allocator: An Object-Caching Kernel Memory Allocato and Magazines and Vmem: Extending the Slab Allocator to Many CPUs and Arbitrary Resources for more information.)
The slab allocator caches objects of a common type to facilitate fast reuse. A slab is a contiguous area of memory, carved up into fixed size chunks. libumem uses a-per CPU cache structure called the magazine layer.
A magazine is essentially a stack. We pop an allocation off the top of the stack and push a freed allocation onto the stack. When the stack hits bottom, the magazine gets reloaded from the vmem layer, the depot. This vmem allocator provides a universal backing store for the magazines. (The magazines tune themselves dynamically, so it might take several minutes to "warm up the slabs" to reach optimum performance.) With libumem, data structures are carefully padded to ensure that each is on its own cache line, thus reducing the potential for false sharing.
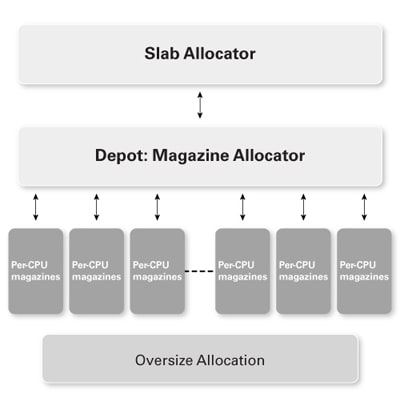
Figure 3. libumem Simplified Architecture
The New mtmalloc Memory Allocator
A rewrite of mtmalloc has been implemented, and it was first available in Oracle Solaris 10 8/11. It is also available in Oracle Solaris 11. (See Performance Improvements for libmtmalloc.)
The lock protecting each cache was eliminated and the updates to the protected information are accomplished using atomic operations. A pointer to the location where the last allocation occurred is stored to facilitate lookups.
Instead of a linked list of caches, there is a linked list of arrays, in which each item in the array points to a cache. This helps locality of reference, which improves performance. When certain flags are set, the threads whose IDs are less than two times the number of vCPUs receive exclusive buckets of memory, thus eliminating the use of the per-bucket lock.
The default size for incremental cache growth for 64-bit applications is 64, not 9, as it was originally. In the following discussion, the new mtmalloc algorithm using exclusive buckets is referred to as new exclusive mtmalloc, and when exclusive buckets are not used, it is referred to as new not-exclusive mtmalloc.
Test Harness
So, which allocator is best?
In order to evaluate the performance of each method, a test harness was developed that does the following:
- Creates a number of allocation threads based on an input parameter
- Creates a freeing thread for each allocation thread
- Does a number of allocations per loop according to input parameters
- Counts loops as the metric of interest
- Uses a random number generator (see
man rand_r) to select the size of each allocation
The maximum allocation size is an input parameter. We shall use 5000 allocations per loop and let each test run for approximately 1200 seconds. We will use maximum allocation sizes of 256, 1024, 4096, 16384, and 65536 bytes.
In addition, we will use LD_PRELOAD_64 to instruct the linker to preload the library to be tested. The use of LD_PRELOAD is also a method of implementing each library in production. Another method of using a different memory allocator is to link the library when the application is built (-lmtmalloc, for example).
The input parameters are explained below and the source code is available on my blog (see Test Harness for Malloc).
The test program, malloc_test, takes the following flags:
-hdisplays help.-cspecifies the sample count (how many three-second samples to publish).-tspecifies the thread count.-sspecifies whether to usememsetfor the allocations;0=no,1=yes.-mspecifies the maximum allocation size in bytes.-rcauses a random number generator to be used determine the allocation size.-nspecifies the number of allocations per loop; 5000 is the maximum.-fspecifies that a fixed number of loops is done and then the program exits;0=no,<em>xx</em>=number of loops.
DTrace can be used to check the distribution of allocation sizes. The following shows the distribution for a 4-KB maximum allocation:
Date: 2011 May 27 12:32:21 cumulative malloc allocation sizes

 malloc
      value ------------- Distribution ------------- count
     < 1024 |@@@@@@@@@@                 2331480
      1024 |@@@@@@@@@@                  2349943
      2048 |@@@@@@@@@@                  2347354
      3072 |@@@@@@@@@@                  2348106
      4096 |                            18323
      5120 |                            0
Here is the DTrace code:
/* arg1 contains the size of the allocation */

pid$target::malloc*:entry
{ @[probefunc]=lquantize(arg1,1024,16684,1024); }
tick-10sec
{       printf("\n Date: %Y cumulative malloc allocation sizes \n", walltimestamp);
        printa(@);
        exit(0); }
Test Results
The initial tests were run on an UltraSPARC T2-based machine that has 1 socket, 8 cores, 64 hardware threads, and 64 GB of RAM. The kernel version is SunOS 5.10 Generic_141444-09. The results show scalability issues with oversize allocations, as shown in Table 1.
An additional test was run on an UltraSPARC T3-based machine that has 2 sockets, 32 cores, 256 hardware threads, and 512 GB of RAM. The kernel version is SunOS 5.10 Generic_144408-04. For this second test, only allocations smaller than 4 KB were used to avoid oversize issues. The results (average loops per second) are summarized in the lower portion of Table 1. You can see the sheer performance of the new exclusive mtmalloc algorithm (green) and some scalability issues for Hoard and libumem with high thread counts (red). The amount of RAM in each system is irrelevant, because we are testing the allocation of address space or empty pages.
Table 1. Allocator Performance Comparison
Table 1. Allocator Performance Comparison
| Loops per Second (lps) | lps | lps | lps | lps | lps | lps |
|---|---|---|---|---|---|---|
| Thread Count/ Allocation Size (UltraSPARC T2) | Hoard | mtmalloc |
umem |
New Exclusivemtmalloc |
New Not-Exclusive mtmalloc |
libc
malloc |
| 1 thread 256 bytes | 182 | 146 | 216 | 266 | 182 | 137 |
| 4 threads 256 bytes | 718 | 586 | 850 | 1067 | 733 | 114 |
| 8 threads 256 bytes | 1386 | 1127 | 1682 | 2081 | 1425 | 108 |
| 16 threads 256 bytes | 2386 | 1967 | 2999 | 3683 | 2548 | 99 |
| 32 threads 256 bytes | 2961 | 2800 | 4416 | 5497 | 3826 | 93 |
| 1 thread 1024 bytes | 165 | 148 | 214 | 263 | 181 | 111 |
| 4 threads 1024 bytes | 655 | 596 | 857 | 1051 | 726 | 87 |
| 8 threads 1024 bytes | 1263 | 1145 | 1667 | 2054 | 1416 | 82 |
| 16 threads 1024 bytes | 2123 | 2006 | 2970 | 3597 | 2516 | 79 |
| 32 threads 1024 bytes | 2686 | 2869 | 4406 | 5384 | 3772 | 76 |
| 1 thread 4096 bytes | 141 | 150 | 213 | 258 | 179 | 92 |
| 4 threads 4096 bytes | 564 | 598 | 852 | 1033 | 716 | 70 |
| 8 threads 4096 bytes | 1071 | 1148 | 1663 | 2014 | 1398 | 67 |
| 16 threads 4096 bytes | 1739 | 2024 | 2235 | 3432 | 2471 | 66 |
| 32 threads 4096 bytes | 2303 | 2916 | 2045 | 5230 | 3689 | 62 |
| 1 thread 16384 bytes | 110 | 149 | 199 | 250 | 175 | 77 |
| 4 threads 16384 bytes | 430 | 585 | 786 | 1000 | 701 | 58 |
| 8 threads 16384 bytes | 805 | 1125 | 1492 | 1950 | 1363 | 53 |
| 16 threads 16384 bytes | 1308 | 1916 | 1401 | 3394 | 2406 | 0 |
| 32 threads 16384 bytes | 867 | 1872 | 1116 | 5031 | 3591 | 49 |
| 1 thread 65536 bytes | 0 | 138 | 32 | 205 | 151 | 62 |
| 4 threads 65536 bytes | 0 | 526 | 62 | 826 | 610 | 43 |
| 8 threads 65536 bytes | 0 | 1021 | 56 | 1603 | 1184 | 41 |
| 16 threads 65536 bytes | 0 | 1802 | 47 | 2727 | 2050 | 40 |
| 32 threads 65536 bytes | 0 | 2568 | 38 | 3926 | 2992 | 39 |
| Thread Count/ Allocation Size (UltraSPARC T3) | Hoard | mtmalloc |
umem |
New Exclusivemtmalloc |
New Not-Exclusive mtmalloc |
libc
malloc |
|---|---|---|---|---|---|---|
| 32 threads 256 bytes | 4597 | 5624 | 5406 | 8808 | 6608 | |
| 64 threads 256 bytes | 8780 | 9836 | 495 | 16508 | 11963 | |
| 128 threads 256 bytes | 8505 | 11844 | 287 | 27693 | 19767 | |
| 32 threads 1024 bytes | 3832 | 5729 | 5629 | 8450 | 6581 | |
| 64 threads 1024 bytes | 7292 | 10116 | 3703 | 16008 | 12220 | |
| 128 threads 1024 bytes | 41 | 12521 | 608 | 27047 | 19535 | |
| 32 threads 4096 bytes | 2034 | 5821 | 1475 | 9011 | 6639 | |
| 64 threads 4096 bytes | 0 | 10136 | 1205 | 16732 | 11865 | |
| 128 threads 4096 bytes | 0 | 12522 | 1149 | 26195 | 19220 |
Remarks and Results
Which memory allocator is best depends on the memory-use patterns of the application. In any situation, the use of an oversized allocation will cause the allocator to become single-threaded.
The new exclusive mtmalloc algorithm has the advantage of a tunable oversize threshold. If your application is one in which you can use the exclusive flag, the new exclusive mtmalloc offers clearly superior performance. But if you cannot use the exclusive flag, libumem gives superior performance for up to 16 threads. The amount of memory in the system does not favor any of the algorithms when measuring how fast address space is allocated. Consider the graph in Figure 4 for 4-KB allocations.
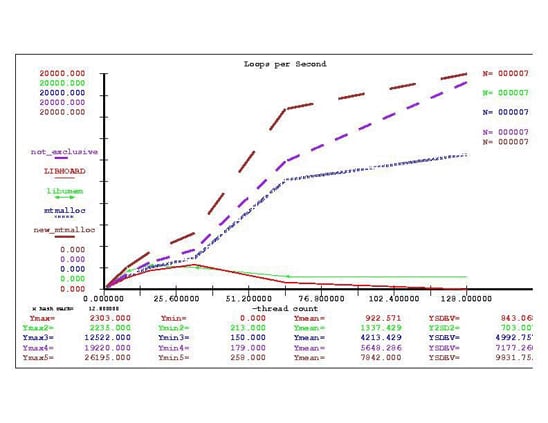
Figure 4. Loops per Second with Hoard, mtmalloc, and libumem
As we can see, libumem and Hoard experienced decreasing scalability when going from 32 to 64 threads, that is, the application's transactions per second actually decreased.
As a tuning exercise, we could experiment with various options for increasing the number of per-thread heaps. The mtmalloc allocators continued to scale with the new mtmalloc algorithm with the exclusive option showing peak performance and the new not-exclusive mtmalloc showing continuing scalability.
Performance
To further examine the performance of each method, we will examine the resource profile for the threads as they execute. In Oracle Solaris, this can be accomplished using the procfs interface.
Using tpry we can collect procfs data on the test harness (see tpry, procfs Based Thread Monitoring SEToolkit Style). Using newbar we can graphically examine the threads of the test harness (see newbar: a Post-Processing Visualization Tool ).
The colors in the graphs in Figure 5 through Figure 9 indicate the following:
- li>Red is the percentage of time spent in the kernel.
- Green is the percentage of time spent in user mode.
- Orange is the percentage of time spent waiting for locks.
- Yellow is the percentage of time spent waiting for CPU.
As you can see, Hoard and libumem experience varying amounts of lock contention (orange), since each bar represents 100% of an interval.
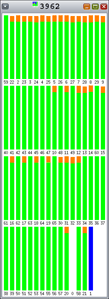
Figure 5. Hoard: Some Lock Contention |

Figure 6. |
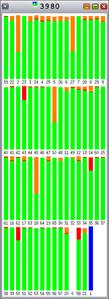
Figure 7. |
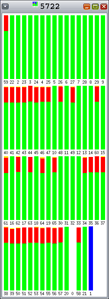
Figure 8. New Not-Exclusive |
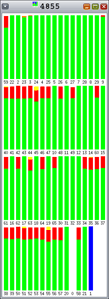
Figure 9. New Exclusive |
Also note that Hoard did not scale to 128 threads. To investigate this further, we can look at the data derived from procfs. Recall that green is the percentage of time spent in user mode, and red is the percentage of time spent in kernel mode. We see increased CPU time in kernel mode (red). See Figure 10.
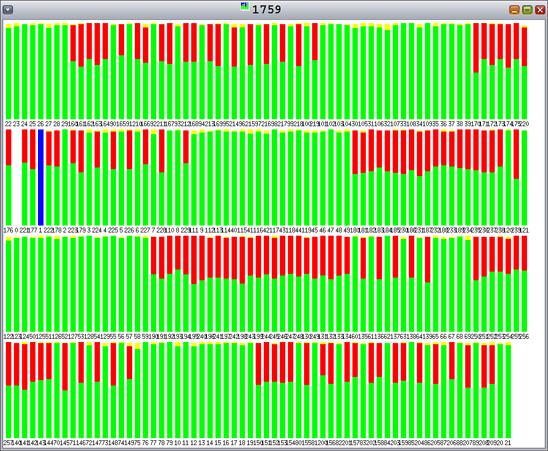
Figure 10. Hoard with 128 Allocating Threads, 128 Freeing Threads, and 4-KB Allocations—Increased Time Spent in Kernel Mode
Using DTrace and truss -c (man -s 1 truss), we determine that the most frequently executed system call is lwp_park. To examine this further, we will use the following DTrace script to see the stack when we performed the most common system call for the application:
syscall::lwp_park:entry

/ pid == $1 /
{  @[pid,ustack(3)]=count();
   self->ts = vtimestamp;  }
tick-10sec
{  printf("\n Date: %Y \n", walltimestamp);
  printa(@);
  trunc(@); }
Executing the script on the UltraSPARC T3-based machine when the test harness was using Hoard, 128 allocation threads, and 128 freeing threads, we see the output shown in Listing 3.
Listing 3. Output from the Script
12 57564           :tick-10sec

 Date: 2011 May 31 17:12:17
3774   libc.so.1`__lwp_park+0x10
       libc.so.1`cond_wait_queue+0x4c
       libc.so.1`cond_wait_common+0x2d4 826252
 12 57564           :tick-10sec
 Date: 2011 May 31 17:12:27
3774   libc.so.1`__lwp_park+0x10
       libc.so.1`cond_wait_queue+0x4c
       libc.so.1`cond_wait_common+0x2d4 891098
So, Hoard is calling libc.so.1`cond_wait_common+0x2d4 and, apparently, thrashing on a condition variable.
On the other hand, libumem experiences lock contention (recall that orange is the percentage of time spent waiting for lock), as shown in Figure 11.
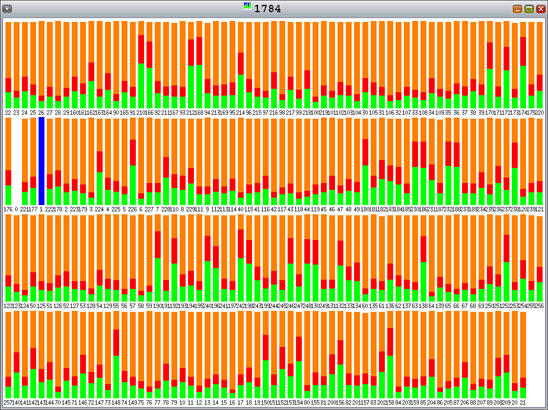
Figure 11. libumem with 128 Allocating Threads, 128 Freeing Threads, and 4-KB Allocations—Lock Contention
The new exclusive mtmalloc algorithm avoids lock contention, as shown in Figure 12.
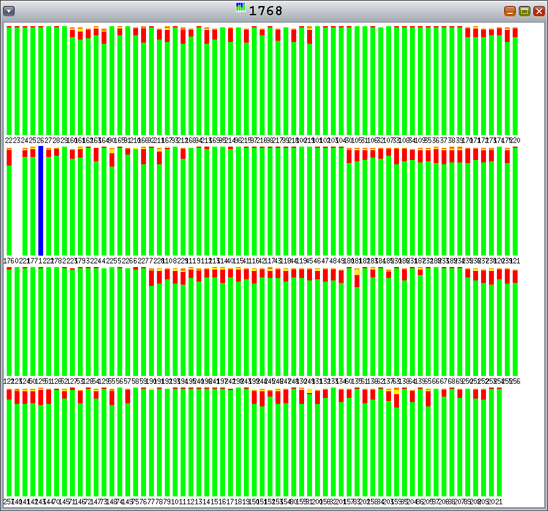
Figure 12. New Exclusive mtmalloc with 128 Allocating Threads and 128 Freeing Threads—No Lock Contention
Fragmentation
In order to compare how effectively the allocators use system memory, the test was repeated for 4-KB allocations.
In this test, memset was used to touch all the allocated memory addresses, thus ensuring that RAM was associated with each address. The application was tested every three seconds to see whether a set number of allocation loops had been executed. The threads were all directed to stop and free their allocations when the allocation limit had been reached.
The ps command was then used to estimate the resident set size (RSS) of the application before exit. The sizes are in kilobytes, so smaller is better.
Table 2. Fragmentation
| Thread Count/ Allocation Size | Hoard | mtmalloc | umem | New Exclusive mtmalloc | New Not-Exclusive mtmalloc |
|---|---|---|---|---|---|
| 32 threads 4096 bytes | 1,073,248 | 1,483,840 | 570,704 | 1,451,144 | 1,451,144 |
The winning libumem memory footprint can be explained by the return of magazines from the per-CPU layer to the depot. Hoard also returns empty superblocks to the global cache.
Each algorithm has its own merits. Hoard lives up to its reputation for reduced fragmentation, whereas mtmalloc sacrificed address space and memory constraints for performance.
All the allocators have options for "tuning" the allocator for the allocation pattern. To get maximum performance, you must examine these options for your application's needs. These results indicate that systems with smaller memory footprints would do better with libumem and Hoard.
libumem had a bit more of a start-up ramp before it reached maximum performance. Figure 13 compares the performance during the first five minutes of a twenty-minute run.
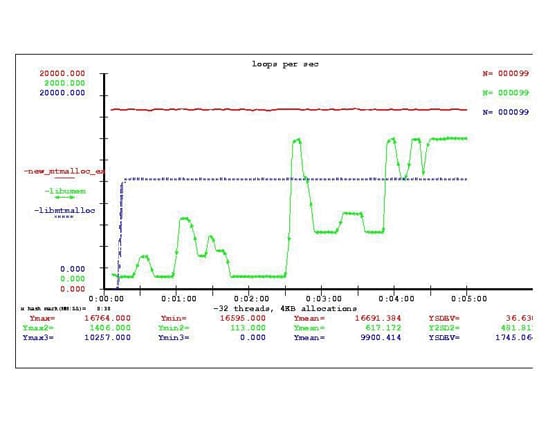
Figure 13. Startup Performance Comparison
Conclusion
As systems become more and more dependent on massive parallelism for scalability, it is important to make the operating environment hospitable to new, highly threaded applications. The memory allocator must be chosen by considering the architecture and the operational constraints of the application.
If low latency (speed) is important as well as quick startup, use the new not-exclusive mtmalloc allocator. If, in addition, your application uses long-lived threads or thread pools, turn on the exclusive feature.
If you want reasonable scalability with a lower RAM footprint, libumem is appropriate. If you have short-lived, over-sized segments, Hoard uses mmap() automatically and, thus, the address space and RAM will be released when free() is called.
Resources
Here are resources referenced earlier in this document:
- Hoard: http://www.hoard.org/
- "Hoard: A Scalable Memory Allocator for Multithreaded Applications": http://www.cs.umass.edu/~emery/hoard/asplos2000.pdf
- "The Slab Allocator: An Object-Caching Kernel Memory Allocator": http://www.usenix.org/publications/library/proceedings/bos94/bonwick.html
- "Magazines and Vmem: Extending the Slab Allocator to Many CPUs and Arbitrary Resources": http://www.usenix.org/event/usenix01/full_papers/bonwick/bonwick_html/index.html
- "Performance Improvements for
libmtmalloc": http://arc.opensolaris.org/caselog/PSARC/2010/212/libmtmalloc_onepager.txt - "Test Harness for Malloc": https://blogs.oracle.com/rweisner/entry/test_harness_for_malloc
- "tpry, procfs Based Thread Monitoring SEToolkit Style": https://blogs.oracle.com/rweisner/entry/tpry_procfs_based_thread_monitoring
- "newbar: a Post-Processing Visualization": https://blogs.oracle.com/rweisner/entry/newbar_a_post_proceesing_visualization