
Real-Time SQL Monitoring
Introduced in Oracle Database 11g, Real-Time SQL Monitoring, provides a very effective way to identify run-time performance problems with resource intensive long-running and parallel SQL statements. Interactive Enterprise Manager screens display details of SQL execution using new, fine-grained SQL statistic that are tracked out-of-the-box with no performance penalty to production systems. Statistics at each step of the execution plan are tracked by key performance metrics, including elapsed time, CPU time, number of reads and writes, I/O wait time and various other wait times. This allows DBAs to analyze SQL execution more deeply than previously possible and decide on the most appropriate tuning strategies for monitored SQL statements.
SQL Monitor active report is a new type of interactive report powered by Enterprise Manager UI technology hosted on OTN. Other active reports are SQL Details
How can I generate real-time SQL monitor active reports?
SQL monitor active reports can be generated directly from EM live UI while viewing a detailed SQL monitor report. There (see save/send e-mail buttons on the top right of that page), the SQL monitor detail page can be either saved or sent by e-mail as an active report. Alternatively, the active report can be directly produced using command line by invoking the PL/SQL procedure dbms_sqltune.report_sql_monitor() using "active" as the report type. For example, the following SQL*Plus script shows how to generate an active report for the statement that was monitored last by Oracle:
set trimspool on
set trim on
set pages 0
set linesize 1000
set long 1000000
set longchunksize 1000000
spool sqlmon_active.html
select dbms_sqltune.report_sql_monitor(type=>'active') from dual;
spool off
The resulting file sqlmon_active.html must be edited to remove the header (first line in the file) and the last line (the spool off). The resulting html file can then be viewed in any browser. The browser must have connectivity to OTN to load the active report code.
Is it possible to generate an active report targeting a live execution?
Yes, this is supported and the active report will show a snapshot of the query execution at the time the report is generated. For example, the following active report shows the live execution of a simple hash-join query (click here to see the active report). The "EXECUTING" status (see green icon at the top) shows that the statement was still executing when the report was generated. Also, on the plan statistics tab, a green arrow on the left side shows the plan steps that were active when the report was generated: here the hash-join is active as well as its build input (which is a full table scan of the customers tables). The report also shows, like in the EM live UI, that the scan of the table customers is 55% done, with only 33s left (see associated tooltip).
On the following SQL Monitor active report , if you select the activity tab, the CPU activity goes higher than the maximum number of CPUs. How is it possible?
Here the SQL statement executes parallel on a 32-way RAC cluster. The degree of parallelism (DOP) used is default, i.e. 64 (twice the number of CPUs). Since the statement is really CPU intensive, PX servers are mostly on CPU, i.e. they are rarely waiting on a wait event. Since we have only 32 CPUs for 64 PX servers, a PX server is either on CPU or waiting to be scheduled by the OS scheduler (i.e. in the run queue). The activity from GV$ACTIVE_SESSION_HISTORY is CPU in both cases but it is really on CPU or waiting for CPU.
On the same active report as above , the Database Time (see "Time & Wait Statistics" in the Overview section) shows a high percentage of "Other" time: 7 hours and 17 minutes for a total database time of 16 hours and 33 minutes. What is this "Other" database time?
Other database time is either run queue time (i.e. time a process waits to get on CPU when the system is CPU bound) or time waiting for an event whose wait class is "Other". Here, it is the former because the wait activity bar shows no wait for an event in the Other wait class and the activity graph shows clearly that half a the database time is waiting for CPU resources (see answer to Question 1).
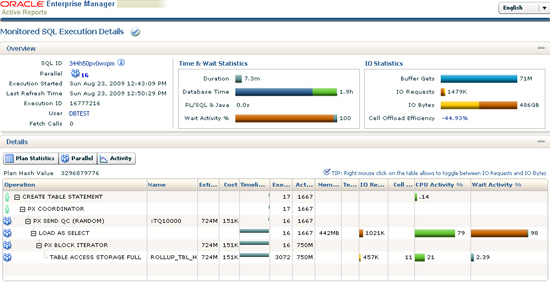
In the plan statistics tab , there is a column "IO Requests" showing the number of IO operations performed by each operation. For example, the full table scan operation has performed 836,020 IOs. Sometimes, for DSS queries, it is better to see the number of IO bytes versus the number of IO requests. Where can I show the number of bytes?
Yes, you can also see the number of bytes. First, both bytes and requests are shown in the tooltip of the bar line. For example, the tooltip shows that 457GB of data where scanned. The tooltip also shows the average IO size, here about 1/2 megabytes. In addition, one can toggle between IO Requests and IO Bytes by using the contextual menu associated to the plan statistics table (select any row in the table and right click, then select "Toggle IO Bytes").
Why DB time is so high, 16.6 hours compared to the duration which is only 16 minutes?
This is because the query executes parallel. In the overview section, the SQL monitor report shows the total database time cumulated over all PX servers plus the query coordinator. The parallel tab shows the breakdown of this database time for each process (you need to fully open the tree view to see that database time at the granularity of each process). As you can see, the database time is now very close to the duration. Actually, the ratio between the database time and the duration can be used to compute the efficiency of the parallel query relatively to the degree of parallelism. For example, here the database time is 59,589s and the duration is 959s. The ratio of the 2 is 62 which is very close to 64 which is the degree of parallelism. In other words, running this query parallel makes it run 62 times faster than running the same execution plan serially. Had the query run serially, the duration would have been more than 62 hours!
when the statement executes parallel like in this example , in icon is shown on the left of each operation in the plan statistics table. This icon is either green with one person or blue/orange with several persons. The same icon is also shown on the parallel tab. What is the meaning of that icon?
This icon helps to understand which type of process has executed which operation in the execution plan. Each icon symbolize a type of parallel process. The green icon represents the query coordinator, which ideally will execute only the "PX COORDINATOR" step in the execution plan (note that the root node in the plan represents the statement type and does not really count here). The other two icons represent a set of parallel execution servers: the blue icon represents set number 1 and the orange icon represents set number 2. Set 2 is only allocated if the execution plan requires a parallel pipeline. Indeed, Oracle parallel execution model allows to execute each operation of an execution plan in parallel, by assigning all PX server processes of one set (either set 1 or set 2) to it. This is called intra-operation parallelism. In addition, two operations of the plan can run concurrently by different sets of parallel execution servers, with data flowing from one operation into the other. This is termed inter-operation parallelism.
On this active report , the degree of parallelism shows 5 (see icon labeled "Parallel" in the Overview section) but when I select the parallel tab I can see that 10 processes were allocated on instance 2 (5 from each set). Why in that case the DOP is not 10 instead of being 5?
The DOP represents the degree of parallelism for intra-operation parallelism. Hence, it is defined as the number of PX server processes in one set (both sets have always the same number of processes), i.e. 5 in this particular example. The reason is that the speed-up of the parallel execution is achieved by using intra-operation parallelism while inter-operation parallelism is only used to avoid extra materialization of intermediate results set. Hence, at best, the speed-up will be 5 for this query and not 10.
Can real-time SQL monitoring be used to monitor anonymous PL/SQL blocks?
Yes, starting from RDBMS 11.2, the execution of any cursor can be monitored, and this includes cursors representing PL/SQL calls or anonymous blocks. See for example the following active report (click here to see active report). Like for any SQL statement, the Overview section of the report shows general information and statistics about the execution. The Detail section of the report shows only one tab, the activity tab. This tab shows the activity of the session when the PL/SQL cursor was executing. When the cursor being monitored is active, the activity is labeled by its type (e.g. CPU or waiting for event XYZ). But when another statement than the statement being monitored is active, then that activity is labeled by the SQL id of the statement being executed. In our example, it is easy to see that the first phase of the PL/SQL is CPU (about 20s) after which 4 recursive SQL statements are issued. In order, SQL IDs 56ppx29nq4jzj, gqm4ga8tnja1r, gh9szbs0nd9ut, and finally 2xjt9pa9hjc6a. The last statement (SQL ID 2xjt9pa9hjc6a) takes most of the execution time, more than half of the duration of the query. Note that when the live EM UI is used instead of the active report, one can click on any of these SQL IDs to drill down to the SQL detail to get more information on the SQL statement, in particular its text and its monitoring information assuming that the execution was also monitored.
On this active report , the icon representing the parallel degree of parallelism has a red arrow pointing downward. What does it means?
This indicates that the degree of parallelism was downgraded, i.e. that less parallel execution servers were allocated to execute the statement than the number requested. The tooltip associated to the parallel icon shows more information about the downgrade. Here, the degree of parallelism was downgraded by 60%, i.e. only 4 PX servers were allocated instead of the 10 that were requested. Note that DOP can be downgraded either because the number of parallel execution servers has reached the limit "parallel_max_servers" or because the parameter "parallel_adaptive_multi_user" is set to true and the load of the server was too high.
What happens when a SQL statement being monitored errors out?
The error number and error message is saved and the execution status is set to error (shown by a red X icon). See for example the following active report (click here to see active report). In addition, all statistics accumulated up to when the statement failed are preserved.
The parallel icon shows the degree of parallelism and optionally the number of instances used when the execution is cross instance. What does it mean when the icon shows that the number of instances used is only 1 like for this active report (click here to see active report). How come the number of instance is 1 and yet the statement ran cross instance?
The statement runs cross-instance when the query coordinator allocates one or more PX servers from a remote instance. The number of instances shown by the report shows the total number of instances used to allocate PX servers. Here, as shown by the parallel tab, all PX servers are allocated in instance 2 while the query coordinator runs on instance 1. As such, the parallel query is cross-instance but all the PX servers are running on a single instance, hence the number of instance used to parallelize the query is 1 (the coordinator is not counted here).
Is it possible to determine the value of bind variables for monitored SQL statements?
Yes, it is. The SQL statment on this active report has values of bind variables in it. To see them click on the round "i" icon next to the SQL ID. A window with the SQL Text will open. It will also display bind variables, if any, their type, position, and values.