Monitoring and Managing Java SE 6 Platform Applications
By Mandy Chung,
August 2006
An application seems to run more slowly than it should or more slowly than it did previously, or the application is unresponsive or hangs. You may encounter these situations in production or during development. What is at the root of these problems? Often, the causes -- such as memory leaks, deadlocks, and synchronization issues -- are difficult to diagnose. Version 6 of the Java Platform, Standard Edition (Java SE) provides you with monitoring and management capabilities out of the box to help you diagnose many common Java SE problems.
This article is a short course in monitoring and managing Java SE 6 applications. It first describes common problems and their symptoms in a Java SE application. Second, it gives an overview of Java SE 6's monitoring and management capabilities. Third, it describes how to use various Java Development Kit (JDK) tools to diagnose these problems.
Note: Any API additions or other enhancements to the Java SE platform specification are subject to review and approval by the JSR 270 Expert Group.
Note: Update: Java VisualVM is a new troubleshooting tool included in the JDK version 6 update 7 and later. Java VisualVM is a tool that provides a visual interface for viewing detailed information about Java applications while they are running on a Java Virtual Machine (JVM), and for troubleshooting and profiling these applications.
Java VisualVM allows developers to diagnose the common problems described in this article, including the ability to generate and analyse heap dumps, thread stack traces, track down memory leaks, and perform and monitor garbage collection activities. In addition, it provides the lightweight CPU and memory profiling capability that enables you to monitor and improve your application's performance. For more information, see Update: Java VisualVM.
Common Problems in Java SE Applications
Typically, problems in a Java SE application are linked to critical resources such as memory, threads, classes, and locks. Resource contention or leakage may lead to performance issues or unexpected errors. Table 1 summarizes some common problems and their symptoms in Java SE applications and lists the tools that developers can use to help diagnose each problem's source.
Table 1. Tools for Diagnosis of Common Problems
| Problem | Symptom | Diagnostic Tools |
|---|---|---|
| Insufficient memory | OutOfMemoryError
|
Java Heap Analysis Tool ( jhat)
|
| Memory leaks | Growing use of memory Frequent garbage collection |
Java Monitoring and Management Console ( jconsole) JVM Statistical Monitoring Tool ( jstat)
|
| A class with a high growth rate A class with an unexpected number of instances |
Memory Map ( jmap) See jmap -histo option
|
|
| An object is being referenced unintentionally | jconsole or jmap with jhat See jmap -dump option
|
|
| Finalizers | Objects are pending for finalization | jconsole jmap -dump with jhat
|
| Deadlocks | Threads block on object monitor or java.util.concurrent locks
|
jconsole Stack Trace ( jstack)
|
| Looping threads | Thread CPU time is continuously increasing | jconsole with JTop
|
| High lock contention | Thread with high contention statistics | jconsole
|
Insufficient Memory
The Java Virtual Machine (JVM) * has the following types of memory: heap, non-heap, and native.
Heap memory is the runtime data area from which memory for all class instances and arrays is allocated. Non-heap memory includes the method area and memory required for the internal processing or optimization of the JVM. It stores per-class structures such as a runtime constant pool, field and method data, and the code for methods and constructors. Native memory is the virtual memory managed by the operating system. When the memory is insufficient for an application to allocate, a java.lang.OutOfMemoryError will be thrown.
Following are the possible error messages for OutOfMemoryErrors in each type of memory:
- Heap memory error. When an application creates a new object but the heap does not have sufficient space and cannot be expanded further, an
OutOfMemoryErrorwill be thrown with the following error message:java.lang.OutOfMemoryError: Java heap space - Non-heap memory error. The permanent generation is a non-heap memory area in the HotSpot VM implementation that stores per-class structures as well as interned strings. When the permanent generation is full, the application will fail to load a class or to allocate an interned string, and an
OutOfMemoryErrorwill be thrown with the following error message:java.lang.OutOfMemoryError: PermGen space - Native memory error. The Java Native Interface (JNI) code or the native library of an application and the JVM implementation allocate memory from the native heap. An
OutOfMemoryErrorwill be thrown when an allocation in the native heap fails. For example, the following error message indicates insufficient swap space, which could be caused by a configuration issue in the operating system or by another process in the system that is consuming much of the memory:java.lang.OutOfMemoryError: request <size> bytes for <reason>. Out of swap space?
An insufficient memory problem could be due either to a problem with the configuration -- the application really needs that much memory -- or to a performance problem in the application that requires you to profile and optimize to reduce the memory use. Configuring memory settings and profiling an application to reduce the memory use are beyond the scope of this article, but you can refer to the HotSpot VM Memory Management white paper (PDF) for relevant information or use a profiling tool such as the NetBeans IDE Profiler.
Memory Leaks
The JVM is responsible for automatic memory management, which reclaims the unused memory for the application. However, if an application keeps a reference to an object that it no longers needs, the object cannot be garbage collected and will occupy space in the heap until the object is removed. Such unintentional object retention is referred to as a memory leak. If the application leaks large amounts of memory, it will eventually run out of memory, and an OutOfMemoryError will be thrown. In addition, garbage collection may take place more frequently as the application attempts to free up space, thus causing the application to slow down.
Finalizers
Another possible cause of an OutOfMemoryError is the excessive use of finalizers. The java.lang.Object class has a protected method called finalize . A class can override this finalize method to dispose of system resources or to perform cleanup before an object of that class is reclaimed by garbage collection. The finalize method that can be invoked for an object is called a finalizer of that object. There is no guarantee when a finalizer will be run or that it will be run at all. An object that has a finalizer will not be garbage collected until its finalizer is run. Thus, objects that are pending for finalization will retain memory even though the objects are no longer referenced by the application, and this could lead to a problem similar to a memory leak.
Deadlocks
A deadlock occurs when two or more threads are each waiting for another to release a lock. The Java programming language uses monitors to synchronize threads. Each object is associated with a monitor, which can also be referred as an object monitor. If a thread invokes a synchronized method on an object, that object is locked. Another thread invoking a synchronized method on the same object will block until the lock is released. Besides the built-in synchronization support, the java.util.concurrent.locks package that was introduced in J2SE 5.0 provides a framework for locking and waiting for conditions. Deadlocks can involve object monitors as well as java.util.concurrent locks.
Typically, a deadlock causes the application or part of the application to become unresponsive. For example, if a thread responsible for the graphical user interface (GUI) update is deadlocked, the GUI application freezes and does not respond to any user action.
Looping Threads
Looping threads can also cause an application to hang. When one or more threads are executing in an infinite loop, that loop may consume all available CPU cycles and cause the rest of the application to be unresponsive.
High Lock Contention
Synchronization is heavily used in multithreaded applications to ensure mutually exclusive access to a shared resource or to coordinate and complete tasks among multiple threads. For example, an application uses an object monitor to synchronize updates on a data structure. When two threads attempt to update the data structure at the same time, only one thread is able to acquire the object monitor and proceed to update the data structure. Meanwhile, the other thread blocks as it waits to enter the synchronized block until the first thread finishes its update and releases the object monitor. Contended synchronization impacts application performance and scalability.
Java SE 6 Platform's Monitoring and Management Capabilities
The monitoring and management support in Java SE 6 includes programmatic interfaces as well as several useful diagnostic tools to inspect various virtual machine (VM) resources. For information about the programmatic interfaces, read the API specifications.
JConsole is a Java monitoring and management console that allows you to monitor the usage of various VM resources at runtime. It enables you to watch for the symptoms described in the previous section during the execution of an application. You can use JConsole to connect to an application running locally in the same machine or running remotely in a different machine to monitor the following information:
- Memory usage and garbage collection activities
- Thread state, thread stack trace, and locks
- Number of objects pending for finalization
- Runtime information such as uptime and the CPU time that the process consumes
- VM information such as the input arguments to the JVM and the application class path
In addition, Java SE 6 includes other command-line utilities. The jstat command prints various VM statistics including memory usage, garbage collection time, class loading, and the just-in-time compiler statistics. The jmap command allows you to obtain a heap histogram and a heap dump at runtime. The jhat command allows you to analyze a heap dump. And the jstack command allows you to obtain a thread stack trace. These diagnostic tools can attach to any application without requiring it to start in a special mode.
Diagnosis With JDK tools
This section describes how to diagnose common Java SE problems using JDK tools. The JDK tools enable you to obtain more diagnostic information about an application and help you to determine whether the application is behaving as it should. In some situations, the diagnostic information may be sufficient for you to diagnose a problem and identify its root cause. In other situations, you may need to use a profiling tool or a debugger to debug a problem.
For details about each tool, refer to the Java SE 6 tools documentation.
Ways to Diagnose a Memory Leak
A memory leak may take a very long time to reproduce, particularly if it happens only under very rare or obscure conditions. Ideally, the developer would diagnose a memory leak before an OutOfMemoryError occurs.
First, use JConsole to monitor whether the memory usage is growing continuously. This is an indication of a possible memory leak. Figure 1 shows the Memory tab of JConsole connecting to an application named MemLeak that shows an increasing usage of memory. You can also observe the garbage collection (GC) activities in the box inset within the Memory tab.
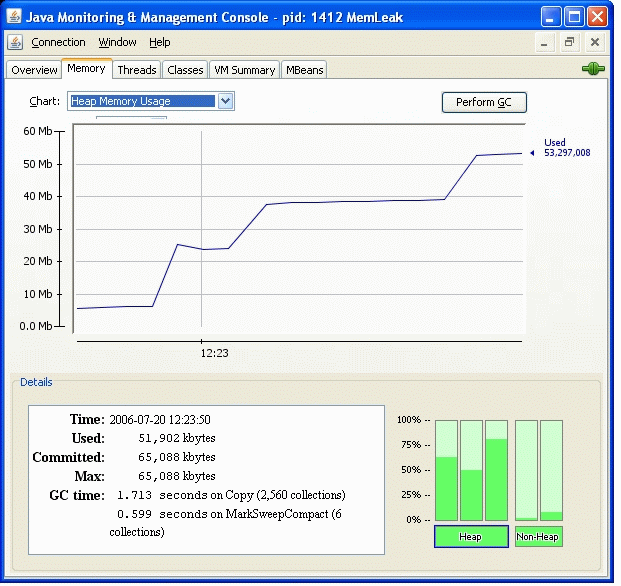
Figure 1: The Memory tab shows increasing memory usage, which is an indication of a possible memory leak.
You can also use the jstat command to monitor the memory usage and garbage collection statistics as follows:
$ <JDK>/bin/jstat -gcutil <pid> <interval> <count>
The jstat -gcutil option prints a summary of the heap utilization and garbage collection time of the running application of process ID <pid> at each sample of the specified sampling <interval> for <count> number of times. This produces the following sample output:
    S0     S1     E      O      P     YGC   YGCT    FGC    FGCT     GCT


    0.00   0.00  24.48  46.60  90.24  142   0.530   104   28.739   29.269


    0.00   0.00   2.38  51.08  90.24  144   0.536   106   29.280   29.816


    0.00   0.00  36.52  51.08  90.24  144   0.536   106   29.280   29.816


    0.00  26.62  36.12  51.12  90.24  145   0.538   107   29.552   30.090
For details about the jstat output and other options to obtain various VM statistics, refer to the jstat man page .
Heap Histogram
When you suspect a memory leak in an application, the jmap command will help you get a heap histogram that shows the per-class statistics, including the total number of instances and the total number of bytes occupied by the instances of each class. Use the following command line:
$ <JDK>/bin/jmap -histo:live <pid>
The heap histogram output will look similar to this:
  num   #instances    #bytes  class name
  --------------------------------------
    1:    100000    41600000  [LMemLeak$LeakingClass;
    2:    100000     2400000  MemLeak$LeakingClass
    3:     12726     1337184  <constMethodKlass>
    4:     12726     1021872  <methodKlass>
    5:       694      915336  [Ljava.lang.Object;
    6:     19443      781536  <symbolKlass>
    7:      1177      591128  <constantPoolKlass>
    8:      1177      456152  <instanceKlassKlass>
    9:      1117      393744  <constantPoolCacheKlass>
   10:      1360      246632  [B
   11:      3799      238040  [C
   12:     10042      160672  MemLeak$FinalizableObject
   13:      1321      126816  java.lang.Class
   14:      1740       98832  [S
   15:      4004       96096  java.lang.String
   < more .....>
The jmap -histo option requests a heap histogram of the running application of process ID <pid>. You can specify the live suboption so that jmap counts only live objects in the heap. To count all objects including the unreachable ones, use the following command line:
|
 Click here for a larger sample.
Ways to Diagnose Looping Threads
Increasing CPU usage is one indication of a looping thread. JTop is a JDK demo that shows an application's usage of CPU time per thread. JTop sorts the threads by the amount of their CPU usage, allowing you to easily detect a thread that is using inordinate amounts of CPU time. If high-thread CPU consumption is not an expected behavior, the thread may be looping.
You can run JTop as a stand-alone GUI:
$ <JDK>/bin/java -jar <JDK>/demo/management/JTop/JTop.jar |
Alternately, you can run it as a JConsole plug-in:
$ <JDK>/bin/jconsole -pluginpath <JDK>/demo/management/JTop/JTop.jar
This starts the JConsole tool with an additional JTop tab that shows the CPU time that each thread in the application is using, as shown in Figure 7. The JTop tab shows that the LoopingThread is using a high amount of CPU time that is continuously increasing, which is suspicious. The developer should examine the source code for this thread to see whether it contains an infinite loop.
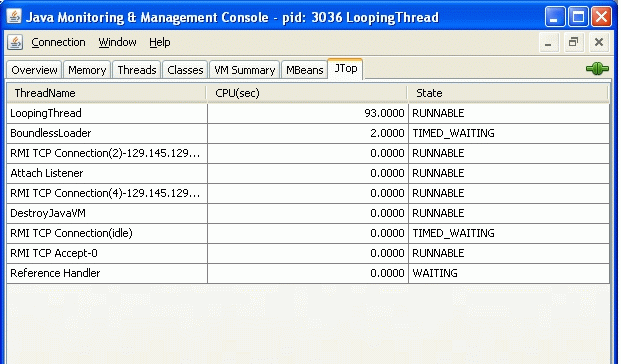
Figure 7: The JTop tab shows how much CPU time each thread in the application uses.
Ways to Diagnose High Lock Contention
Determining which locks are the bottleneck can be quite difficult. The JDK provides per-thread contention statistics such as the number of times a thread has blocked or waited on object monitors, as well as the total accumulated time spent in lock contention. Information about the number of times that a thread has blocked or waited on object monitors is always available in the thread information displayed in the Threads tab of JConsole, as shown in Figure 8.
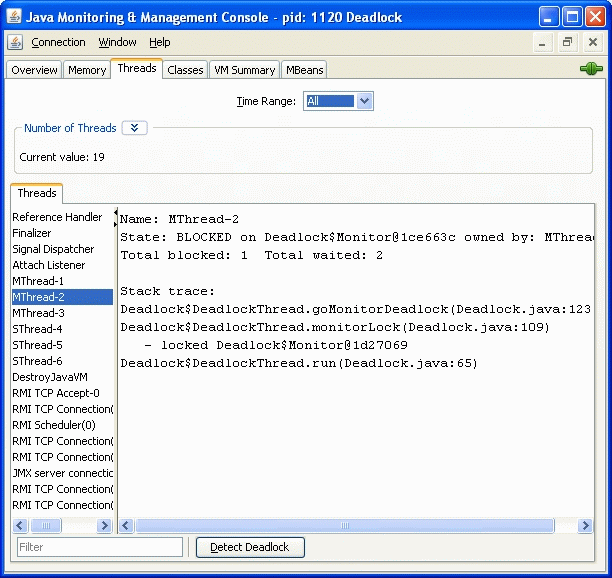
Figure 8: The Threads tab shows the number of times that a thread has blocked or waited on object monitors.
But the ability to track the total accumulated time spent in contention is disabled by default. You can enable monitoring of the thread contention time by setting the ThreadContentionMonitoringEnabled attribute of the Threading MBean to true, as shown in Figure 9.
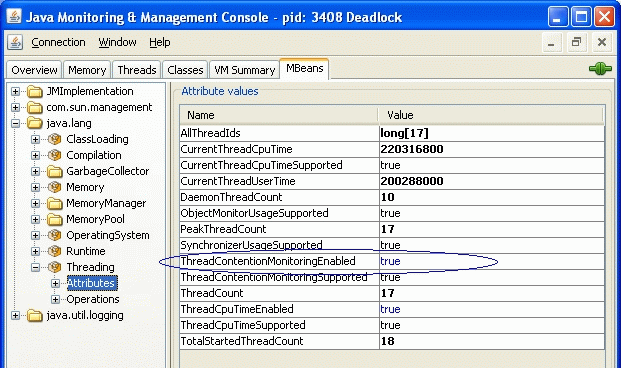
Figure 9: Enable monitoring of the thread contention by setting the ThreadContentionMonitoringEnabled attribute of the Threading MBean.
You can check the thread contention statistics to determine whether a thread has higher lock contention than you expect. You can get the total accumulated time a thread has blocked by invoking the getThreadInfo operation of the Threading MBean with a thread ID as the input argument, as Figure 10 shows.
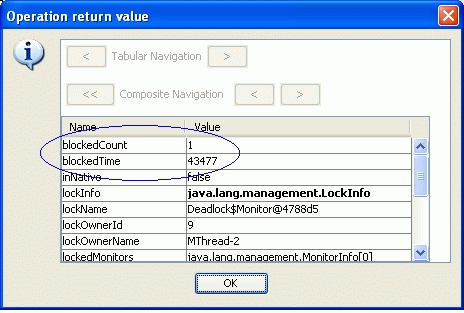
Figure 10: Here is the return value of the getThreadInfo operation of the Threading MBean.
Summary
The Java SE 6 platform provides several monitoring and management tools that allow you to diagnose common problems in Java SE applications in production and development environments. JConsole allows you to observe the application and check the symptoms. In addition, JDK 6 includes several other command-line tools. The jstat command prints various VM statistics including memory usage and garbage collection time. The jmap command allows you to obtain a heap histogram and a heap dump at runtime. The jhat command allows you to analyze a heap dump. And the jstack command allows you to obtain a thread stack trace. These diagnostic tools can attach to any application without requiring it to start in a special mode. With these tools, you can diagnose problems in applications more efficiently.
For More Information
- Monitoring and Management for the Java Platform
- J2SE 5.0 Troubleshooting and Diagnostic Guide (PDF)
- Memory Management in the Java HotSpotVirtual Machine (PDF)
- Tuning Garbage Collection With the 5.0 Java Virtual Machine
- What's New in Java SE 6 Beta 2
About the Author
Mandy Chung is the lead of Java SE monitoring and management at Sun Microsystems. She works on the java.lang.management API, out-of-the-box remote management, JConsole, and other HotSpot VM serviceability technologies. Visit her blog.
* The terms "Java Virtual Machine" and "JVM" mean a Virtual Machine for the Java platform.
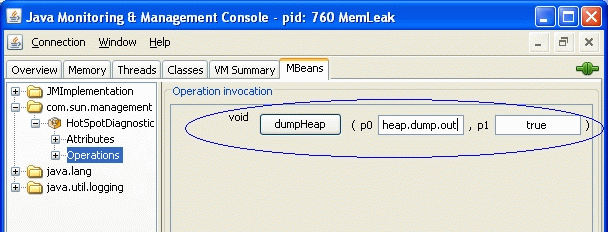
If you use Java SE 6 build 95 or earlier, the dumpHeap operation takes only the first argument and dumps only live objects.
