Using Interactive Report Regions
Purpose
This tutorial shows you how to use an Interactive Report created using Oracle Application Express.
Note: Some screenshots in this tutorial may be slightly different depending on what browser you use.
Time to Complete
Approximately 50 minutes
Overview
Interactive Reports allow developers to define queries that can be highly customized by end-users. Users can customize the layout of the data by choosing the columns they are interested in like, applying filters, highlighting, and sorting. They can also define breaks, aggregations, computed columns and include a chart of the query results. Users can create multiple variations of the report and save them as named reports, output to comma-delimited files, and print to PDF documents.
An Interactive Report can be customized in three ways:
| . |
Search Bar |
|---|---|
| . |
Actions Menu |
| . |
Column Heading Menu |
Prerequisites
Before starting this tutorial, you should:
- Install Oracle Database 11g.
- Install Oracle Application Express 4.1.
Searching for Information in Your Report
The search bar in Interactive Report Region contains the following:

| . |
The Select Columns icon identifies which column to search (or all). |
|---|---|
| . |
The Text Area allows you to enter case insensitive search criteria (no need for wild cards). |
| . |
The Rows drop-down list allows you to select the number of records to display per page. |
| . |
The Go button executes the search. |
| . |
The Actions Menu display the tasks you can perform on the Interactive Report. This is discussed in a later topic. |
To examine how the Search bar works, perform the following steps:
|
. |
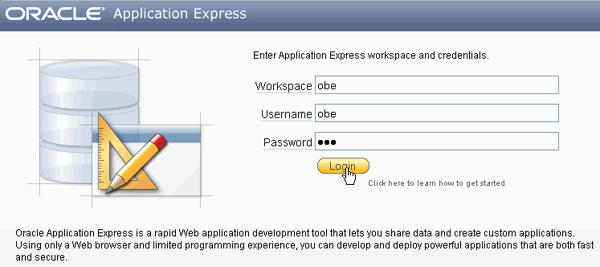
Enter the following URL to log in to Oracle Application Express. http://localhost:8080/apex
|
|---|---|
|
. |
To log in to Oracle Application Express, enter the following details,
and click Login.
|
|
. |
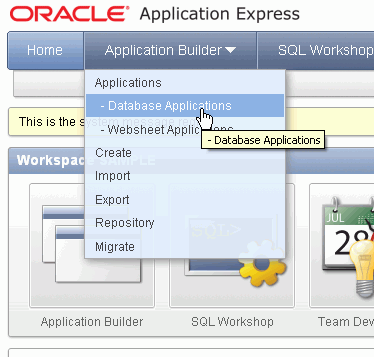
Select Application Builder > Database Applications.
|
|
. |
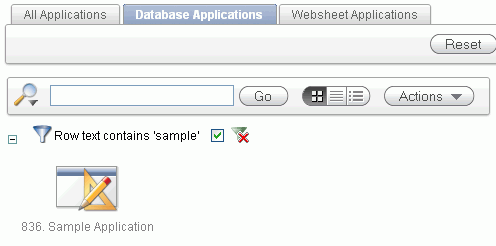
Enter sample in the text area and click Go.
|
|
. |
Click Sample Database Application.
|
|
. |
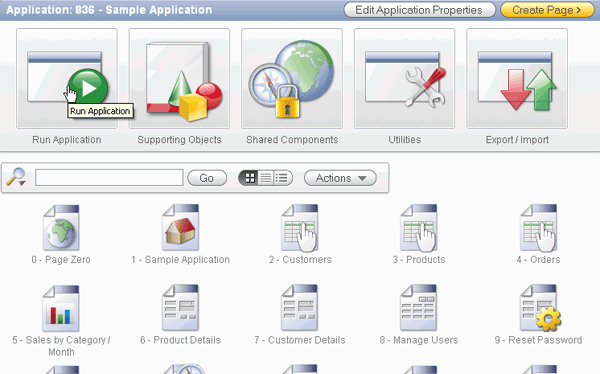
Click Run Application.
|
. |
Login as the obe user and the password is the all lowercase name of the workspace in which this application is located. Hint: the workspace name is displayed in the lower left corner of the application home page.
|
. |
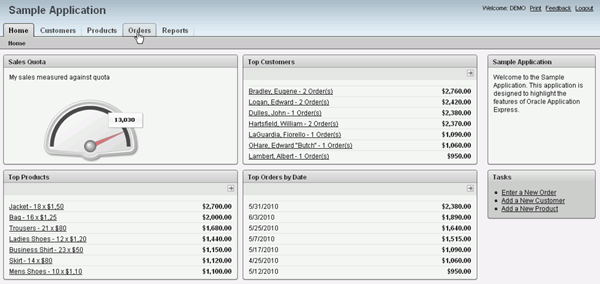
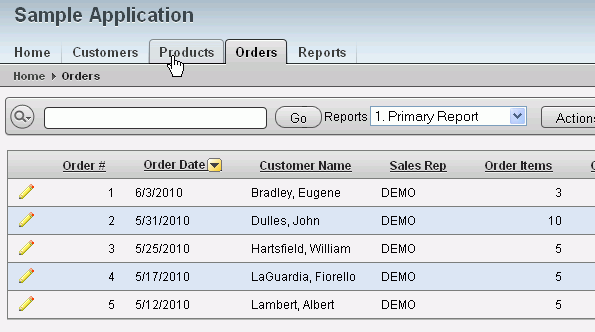
The Sample Application home page is displayed. Select the Orders tab.
|
. |
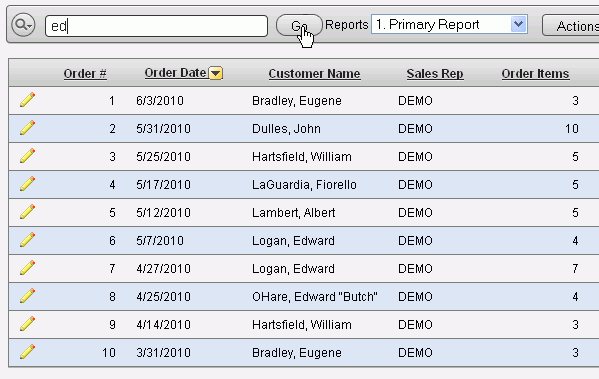
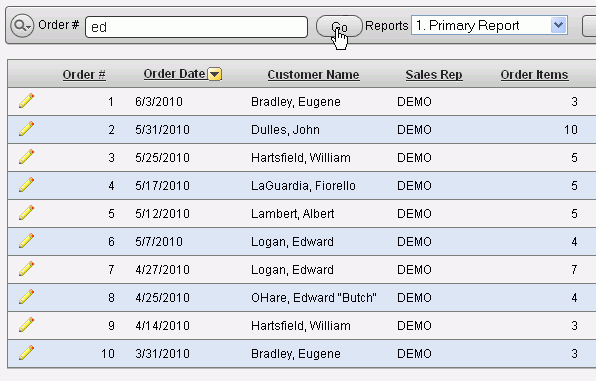
Enter ed in the text area and click Go. Note: when the Sample Application is installed, the dates are updated so that the orders are current. As a result, you may have slightly different data in your report.
|
. |
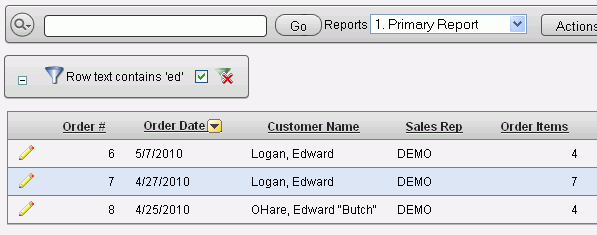
The search is not case sensitive, so it finds 'Ed' in the Customer Name. Notice that the filter shown below no longer has the word in the text area which allows you to create multiple filters.
|
. |
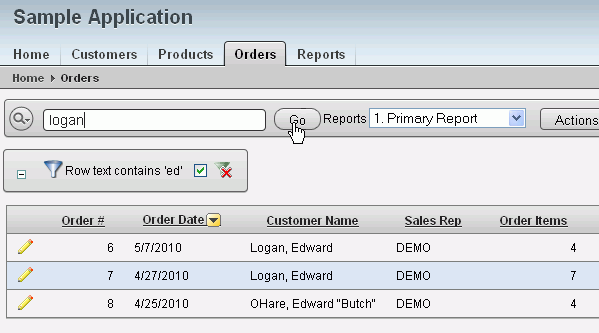
Create another filter. Enter logan in the text area and click Go.
|
. |
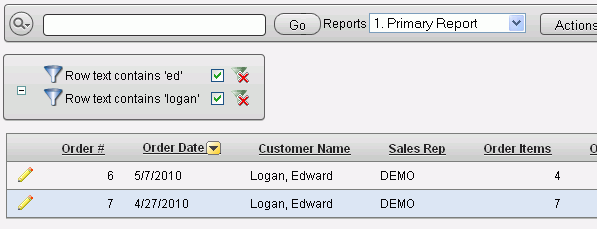
Notice that the list only shows rows that meet both filter criteria.
|
. |
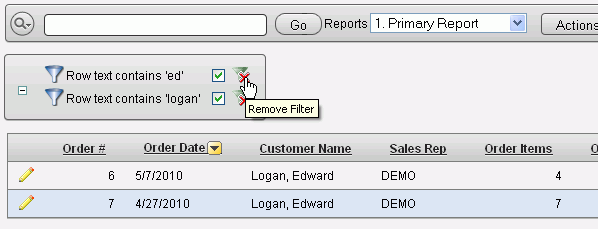
You can remove a filter by clicking the red X next to the filter you want to remove. Click the red X next to the first filter.
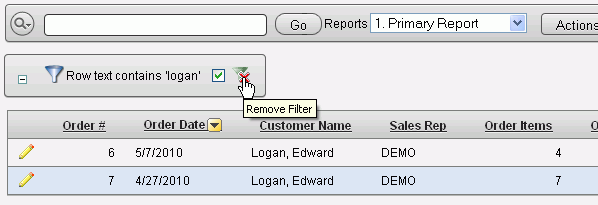
Remove the other filter by clicking the red X.
|
. |
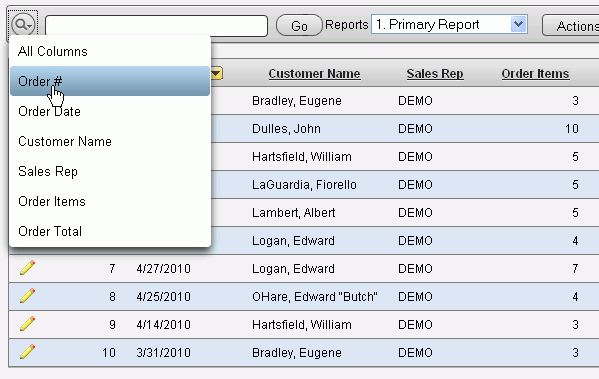
You can also create a filter for just one column using the select columns
icon. Click the Search Columns icon
|
. |
Enter ed in the text area and click Go.
|
. |
This time you receive no hits because the filter was only applied to the Customer Name column. Click the red X next to the filter to remove it.
|
. |
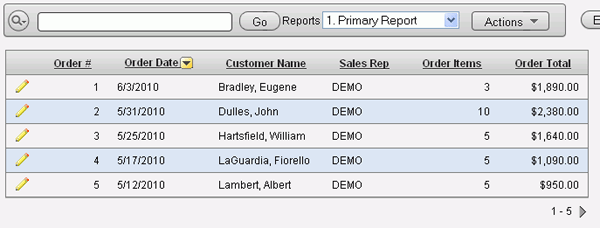
You can change the number of rows that are displayed in an Interactive Report. Click Rows, and select 5.
|
. |
Notice that only 5 rows are shown and the arrow is displayed to indicate that there is another page of data..
|
Viewing Your Report in Different Ways
You can view your report in different ways by performing the following steps:
| . |
Select the Products tab.
|
|---|---|
| . |
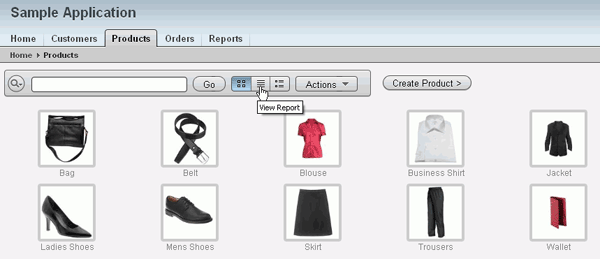
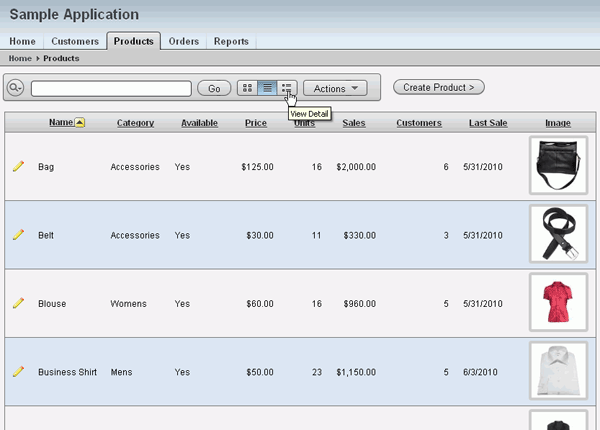
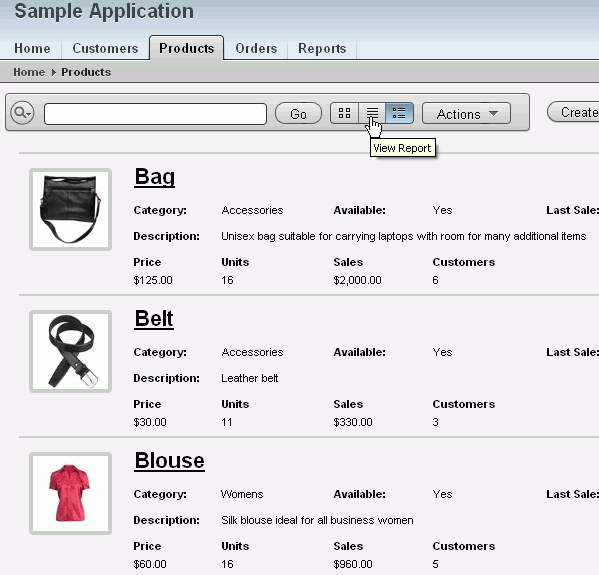
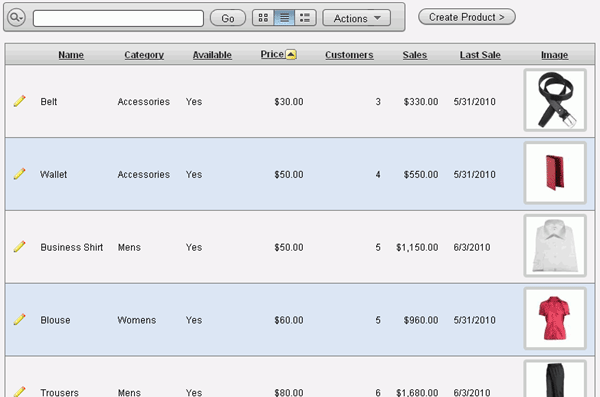
The default view for this report is View Icons. You can change the view. Click the View Report icon.
|
| . |
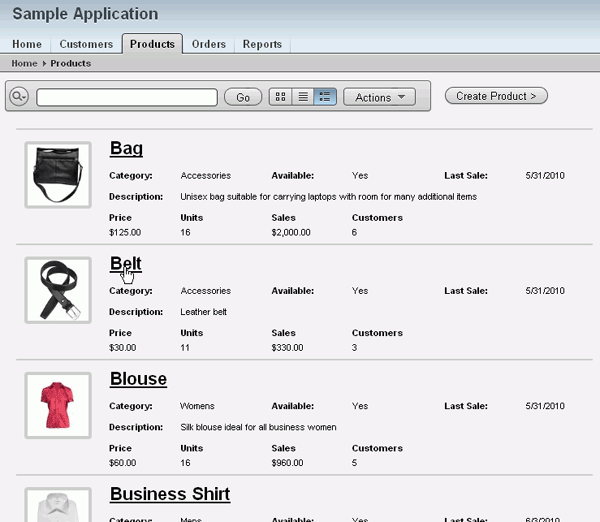
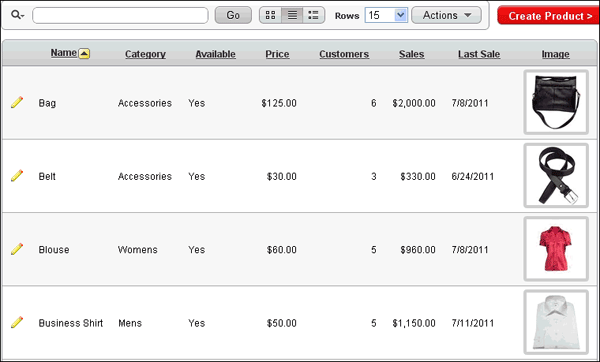
The report is displayed. You can change the view to show all the details. Click the View Detail icon.
|
| . |
The Detail report is displayed. You can edit the information by clicking on one of the product names.
|
| . |
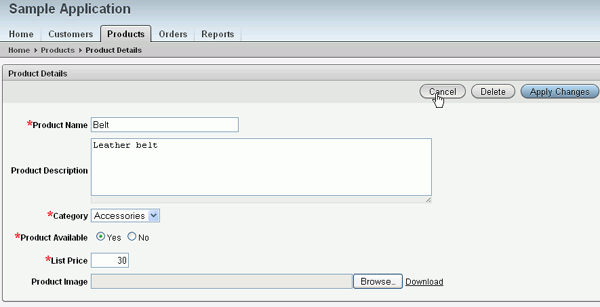
Another page is displayed with a form that allows you to edit the information. In this case, click Cancel to return to the report.
|
Manipulating the Interactive Report Using the Actions Menu
The Actions Menu contains many tasks that are useful in manipulating your Interactive Report. All Interactive Reporting functions from the Actions Menu are exposed in this example report. For reports that you use within other applications in your environment, the developer can limit the functions available. Perform the following tasks:
Selecting Columns
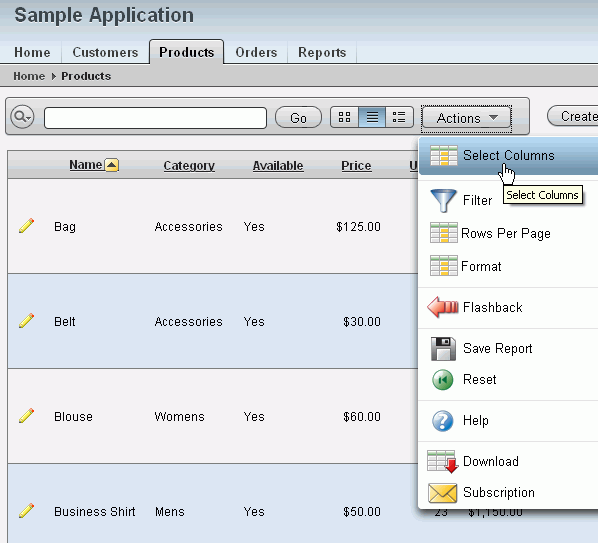
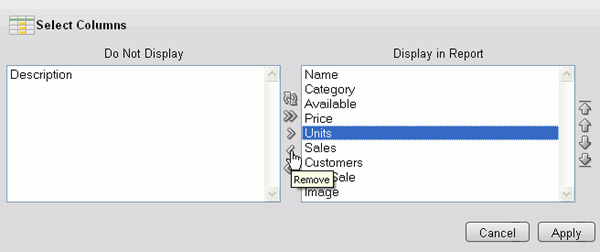
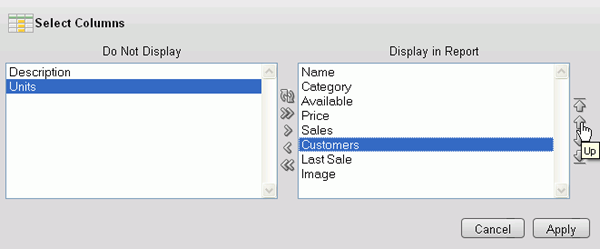
This action is used to modify the columns displayed. The columns on the right are displayed. The columns on the left are hidden. You can reorder the displayed columns using the arrows on the far right. Computed columns are prefixed with **. Perform the following steps:
|
. |
Click the View Report icon.
|
|---|---|
|
. |
Click Actions and select Select Columns.
|
|
. |
To hide columns from the report display, select the Units column and click < to move the column to the Do Not Display area.
|
| . |
To reorder the columns, select the Customers column and click the Up arrow.
|
| . |
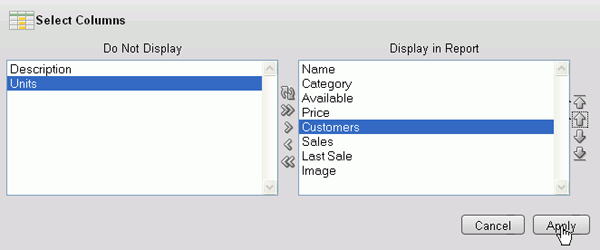
Click Apply to see the changes to the Report.
|
|
. |
The changes you made have been applied.
|
Adding a Filter
This action is used to add or modify the where clause on the query. You first select a column (it does not need to be one that is displayed), select from a list of standard Oracle operators (=, !=, not in, between), and enter an expression to compare against. The expression is case sensitive and you can use % as a wild card (e.g. NAME like B%). Perform the following steps:
|
. |
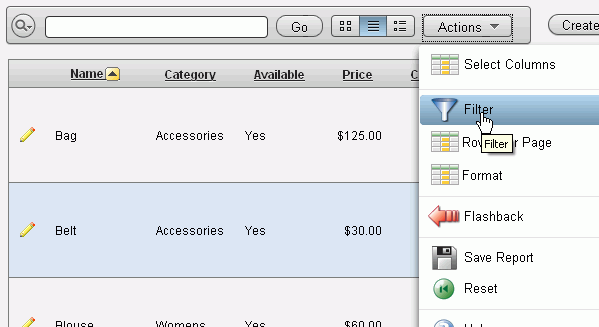
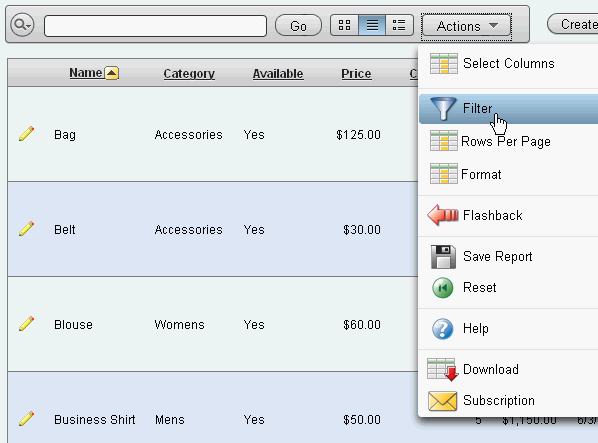
Click Actions and select Filter.
|
|---|---|
| . |
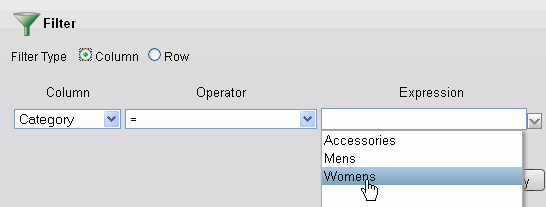
You want to create a filter where the Category = Womens. From the Column drop-down list, select Category.
|
. |
Select Womens from the list of expressions. Notice that this list of values is determined automatically based on all the values in the Category column. The list of expressions can show up to 500 unique values.
|
| . |
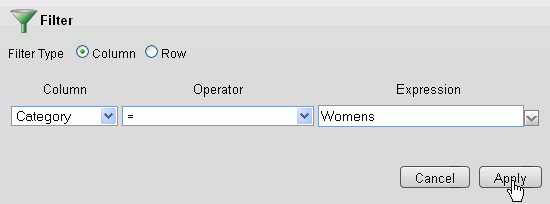
Click Apply to create the filter.
|
| . |
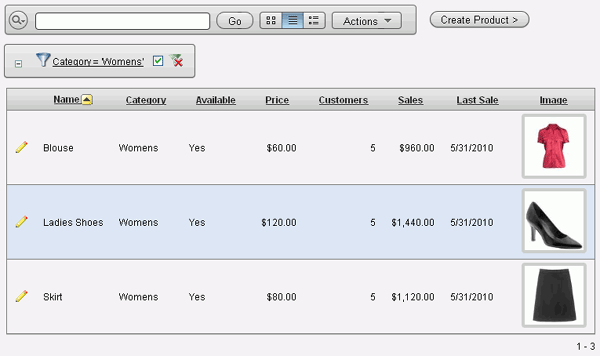
The filter has been applied. You can have more than one filter for a report. If you decide that you want to disable a particular filter, you can click the check box to disable the filter.
|
| . |
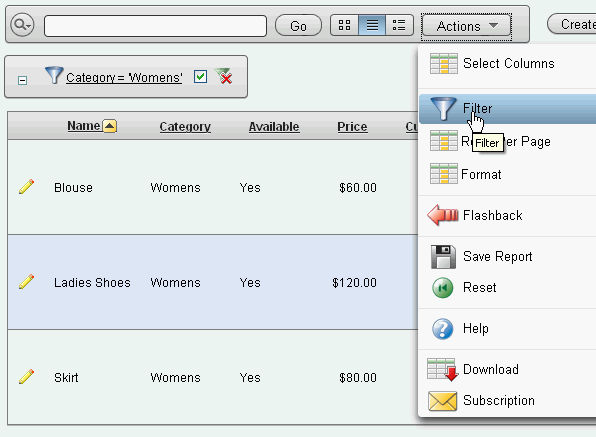
You can add another filter. Click Actions and select Filter.
|
. |
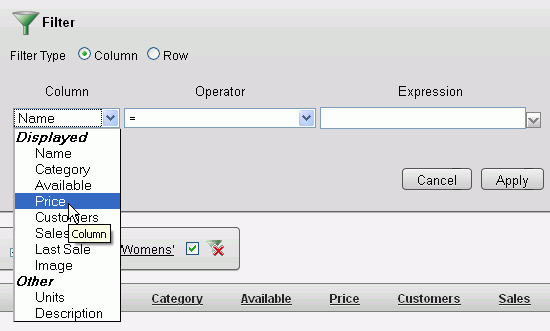
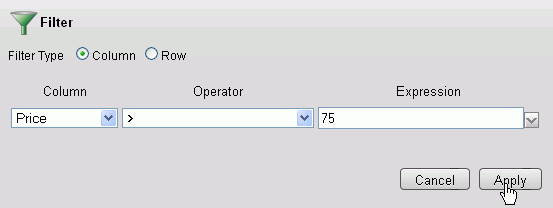
Select Price from the list of columns.
|
| . |
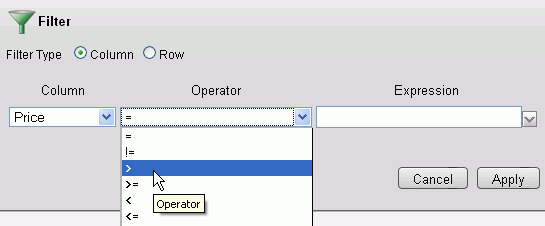
Select > for the Operator.
|
| . |
Enter 75 for the Expression and click Apply.
|
| . |
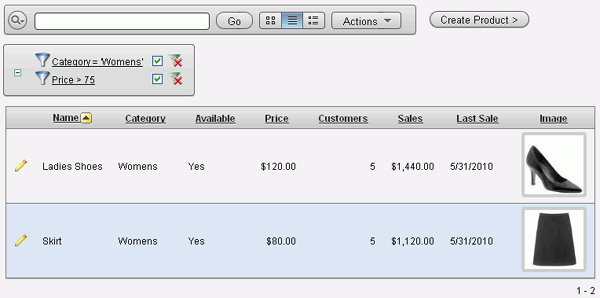
Notice that there are now 2 filters applied. The rows displayed are fewer now because they are only the rows that meet the filter criteria.
|
. |
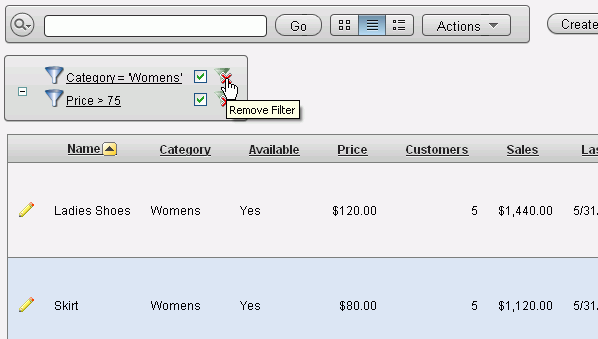
You can remove each filter by clicking the red X next to the filter you want to remove. Click the red X for both the Price > 75 and Category=Women filters.
|
|
. |
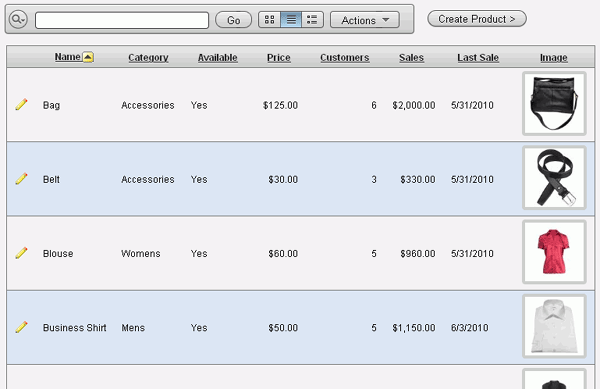
The filters have been removed.
|
|
. |
You can also create a row filter. Click Actions and select Filter.
|
|
. |
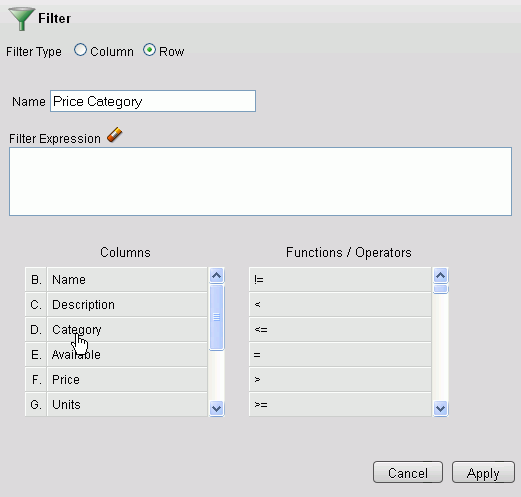
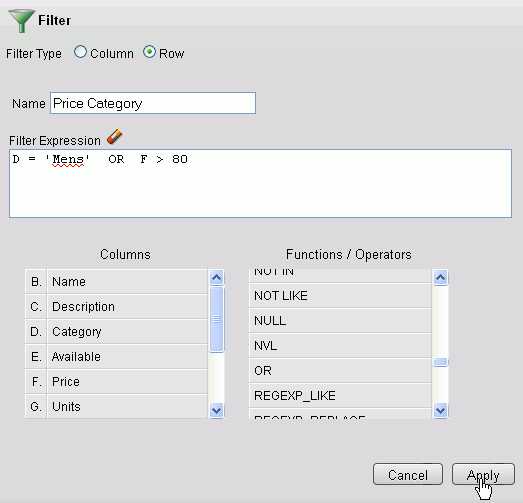
You want to create a filter where the row will be selected if the Category is Mens OR the price is greater than $80. Select the Row filter type, enter Price Category for Name and under the list of Columns, select Category.
|
|
. |
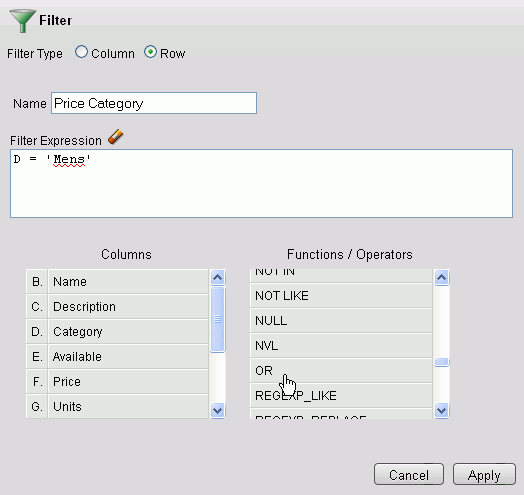
Type = 'Mens' in the Filter Expression area after the D (representing the Category column). Then scroll down the list of Functions / Operators and select OR.
|
|
. |
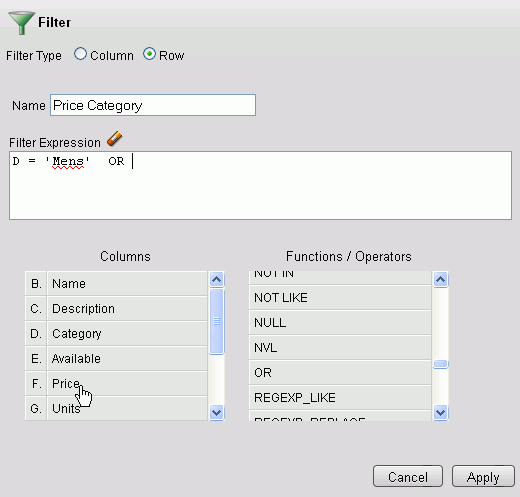
Select Price from the list of Columns.
|
|
. |
Enter > 80 in the Filter Expression area after the F (representing the Price Column) and click Apply.
|
|
. |
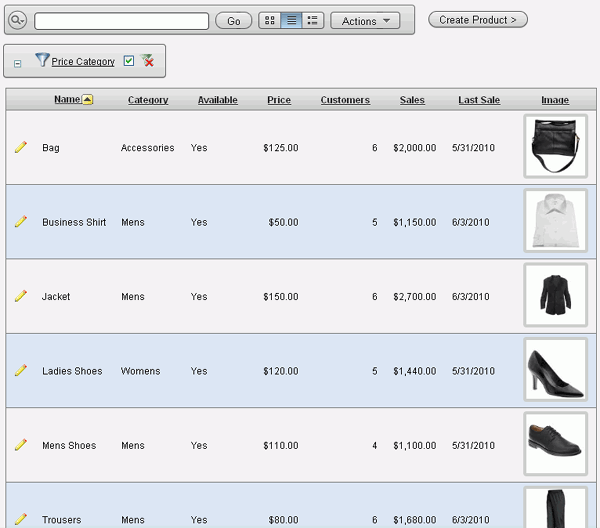
The Price Category filter is applied. You only see rows that are either the Mens category or the price is over $80.
|
|
. |
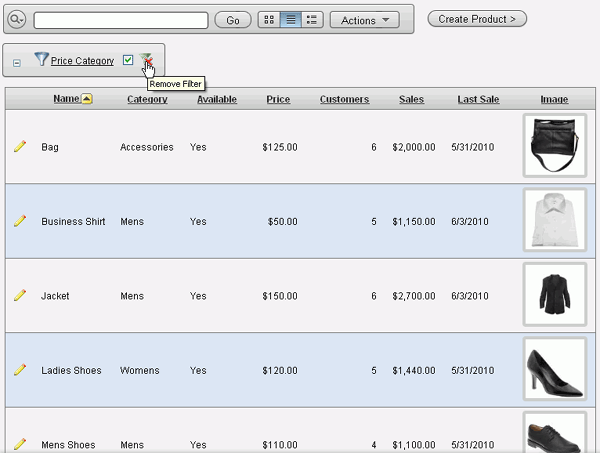
You can click the Remove filter icon to remove the filter.
|
Sorting Columns
This action is used to change the column(s) to sort on and whether to sort
ascending or descending. You can also specify how to handle nulls (use the
default setting, always display them first or last). The resulting sort result
is displayed to the right of the column heading in the report. Perform the
following steps:
|
. |
Click Actions and select Format > Sort.
|
|---|---|
. |
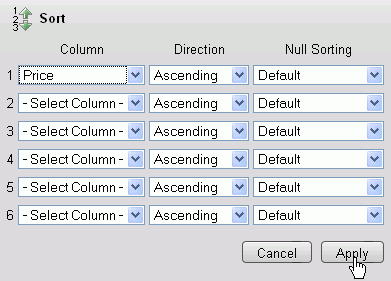
You want to sort the report in ascending order by price. From the Column drop-down list select Price.
Note: The null sorting field indicates where null values should appear in the report for the column being sorted. If set to default, nulls will default to the value set in the Direction field for this sort entry. You can also force nulls to always show first or last.
|
| . |
Click Apply to sort the report.
|
|
. |
Notice that the report is now sorted by Price. The sort indicator is located next to the columns that are sorted. The arrow indicates whether it is in ascending or descending order.
To change the sort to descending order, you can click on the sort ascending icon in the header for Price and it will change to sort descending. This is discussed and shown in a later topic.
|
Creating Control Breaks
This action is used to create a break group on one or several columns. Thecolumn is extracted out of the Interactive Report and displayed as a master record. Perform the following steps:
|
. |
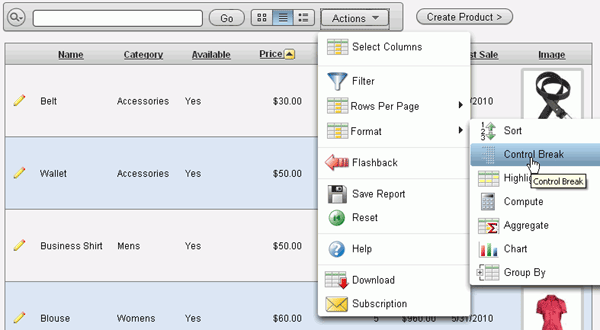
Click Actions and select Format > Control Break.
|
|---|---|
| . |
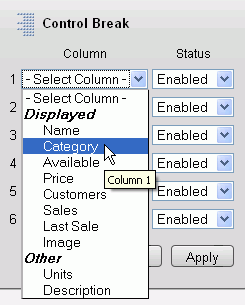
You want to create a control break on Category. From the Column drop-down list select Category.
|
| . |
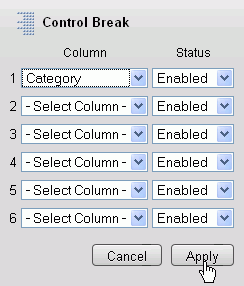
Click Apply to create the control break
|
|
. |
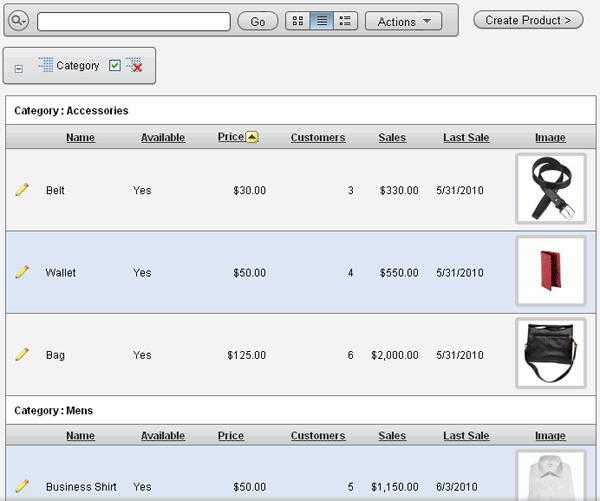
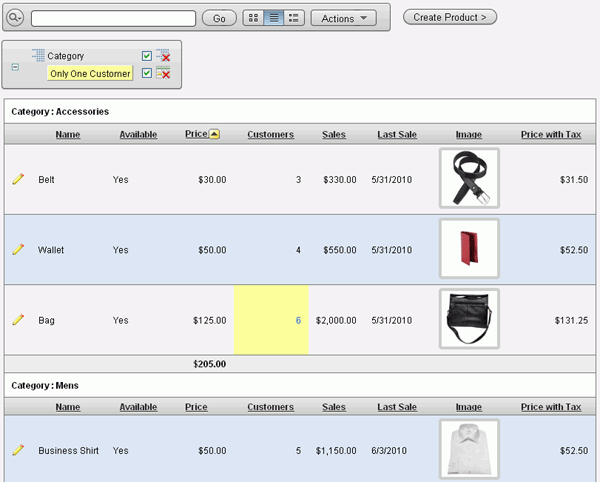
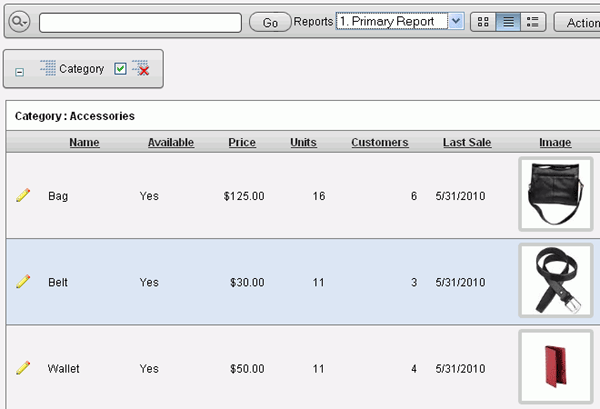
Notice that the control break was created and the Category column was extracted from the report. In this case, the report now shows a list of Products by Category.
|
Highlighting Columns Based on a Filter
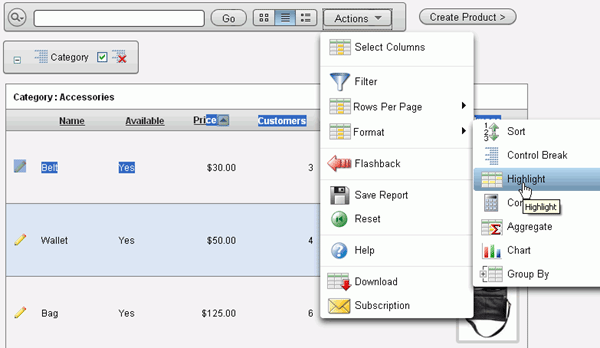
This action is used to highlight specific rows or cells based on a filter. The rows or cells that meet the filter are highlighted using the characteristics associated with the filter. Perform the following steps:
|
. |
Click Actions and select Format > Highlight.
|
|---|---|
| . |
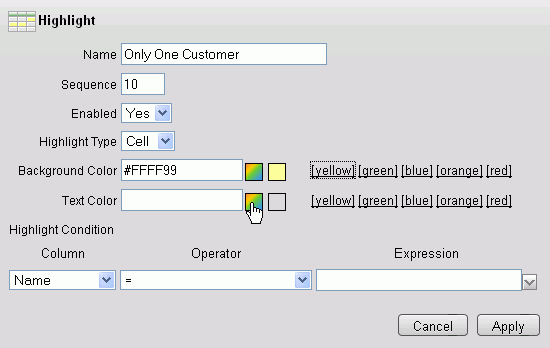
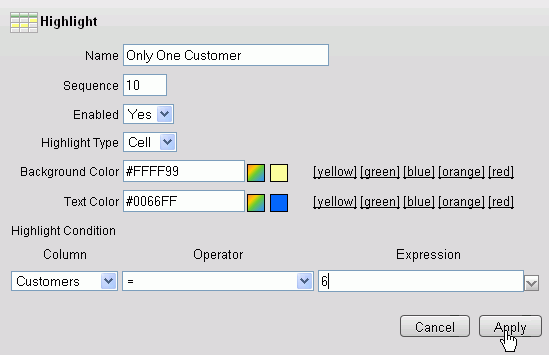
Enter Only One Customer for the Name and select Cell for the Highlight Type. Notice that you can also highlight for an entire row if the row meets the criteria that was set for the filter.
|
| . |
Select [yellow] for the Background Color and select the color icon for the Text Color.
|
. |
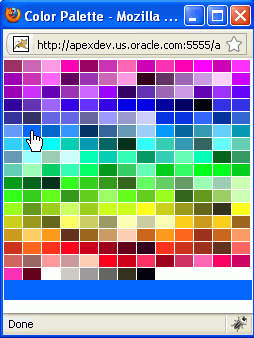
Select any color from the palette and click
|
| . |
You want to highlight the Customers cell when the value is set to 6. From the Column drop-down list select Customers. Then enter 6 for the Expression and click Apply.
|
|
. |
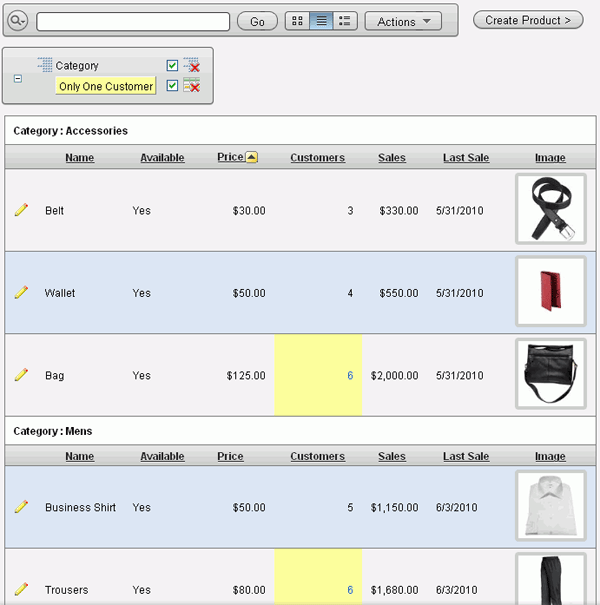
The filter has been applied and the cells that meet the criteria are now highlighted.
|
Adding Computed Columns
This action is used to add computed columns to your report. These can be mathematical computations (e.g. NBR_HOURS/24) or standard Oracle functions applied to existing columns (some have been displayed, for example, others, such as TO_DATE, can also be used). Perform the following steps:
|
. |
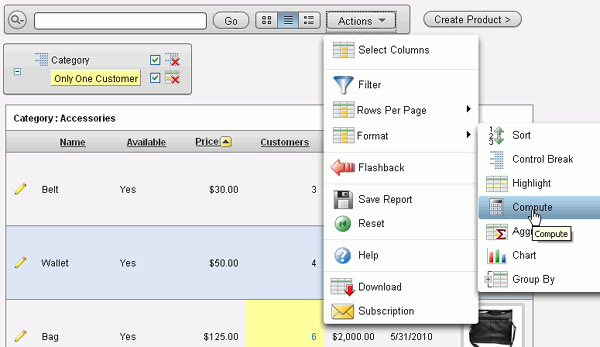
Click Actions and select Format > Compute.
|
|---|---|
| . |
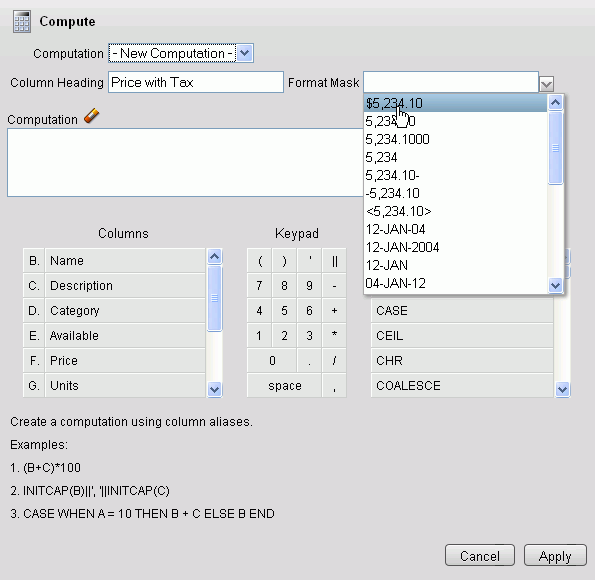
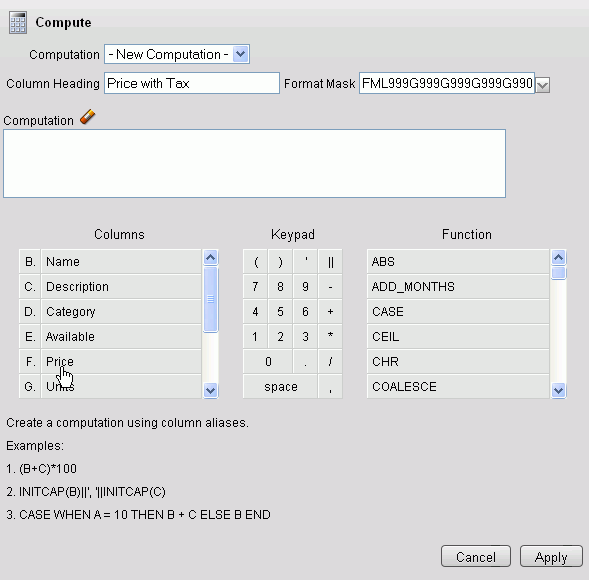
You want to create a computation column that has the calculation Price * 1.05. Enter Price With Tax for the Column Heading and select the down arrow for the format mask and select $5,234.10.
|
| . |
Click Price from the list of Columns.
|
. |
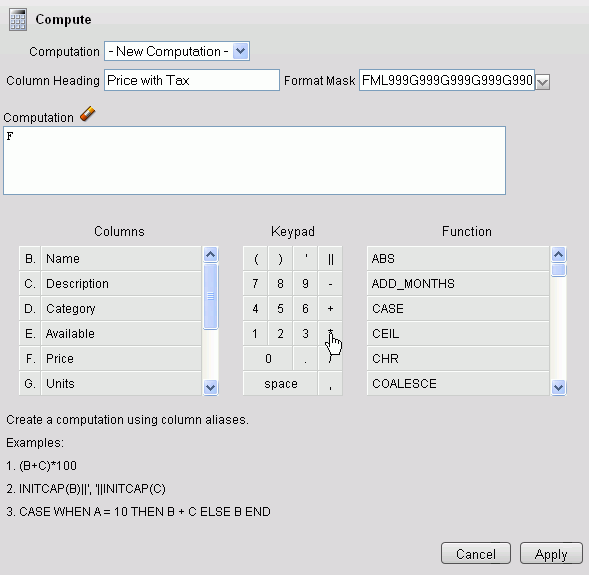
An F will appear in the Computations area. F appears because column aliases are used for the columns and the alias is displayed in the table on the left. Click * from the Keypad.
|
. |
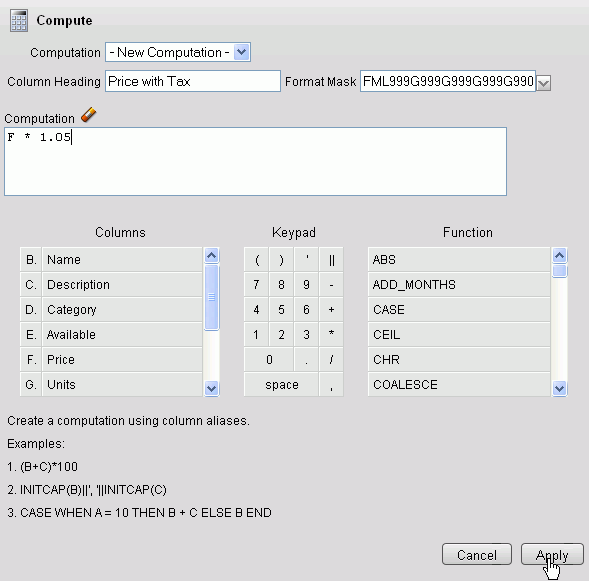
An * will now appear after the F in the Computations area. Enter 1.05 after the * so that the computation now reads F*1.05. Then click Apply.
|
|
. |
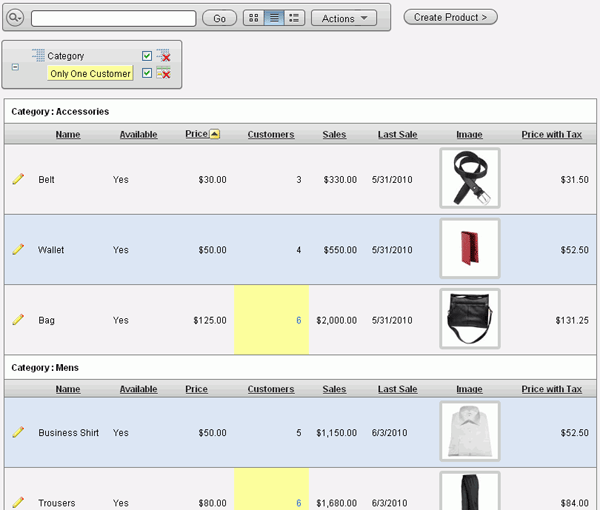
The new computed column now appears in the report.
|
Aggregating Columns
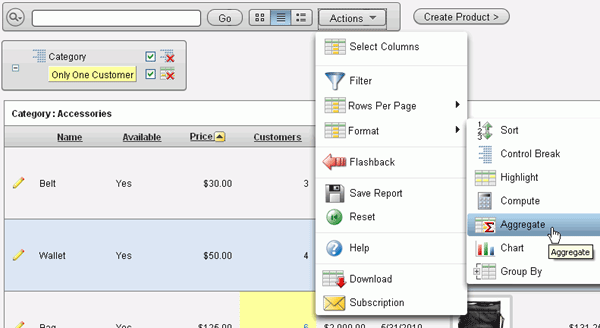
This action is used to aggregate columns in your report. Aggregates are mathematical computations performed against a column. Aggregates are displayed after each control break and at the end of the report within the column they are defined. Perform the following steps:
|
. |
Click Actions and select Format > Aggregate.
|
|---|---|
. |
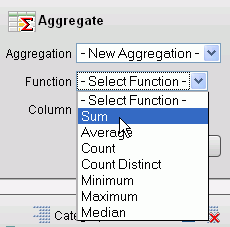
You want to add an aggregate that is a sum of Price. Select Sum from the list of Functions.
|
. |
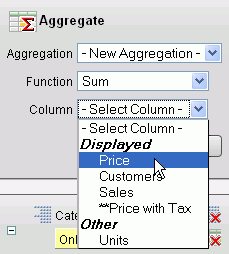
Select Price from the list of Columns.
|
| . |
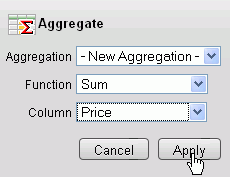
Click Apply.
|
|
. |
The aggregate now appears in the report. Notice that the sum is shown for Price per control break.
|
Creating a Chart
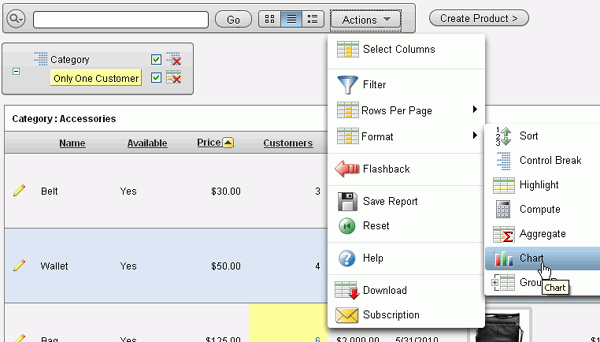
This action is used to create a chart based upon the data contained within your report. You can include one chart per Interactive Report. Once defined, you can switch between the chart and report views using links below the search bar. Perform the following steps:
|
. |
Click Actions and select Format > Chart.
|
|---|---|
. |
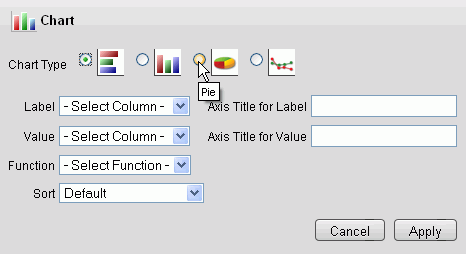
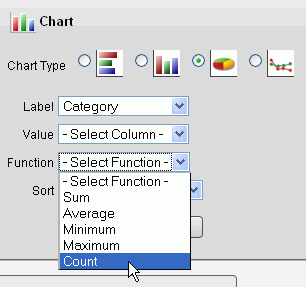
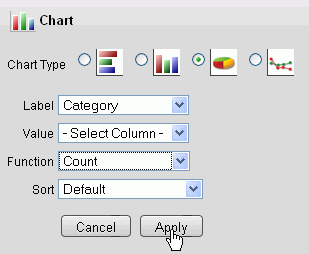
You want to create a pie chart that shows how many products there are per category. Select the Pie chart type.
|
. |
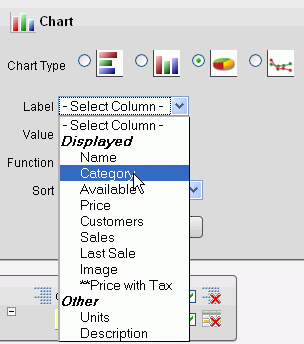
Select Category for the Label.
|
| . |
Select Count for the Function. Note: You do not select a column for Value in this case because you are doing a count. For other functions, you would select a Value column.
|
. |
For pie charts, you can select a sort order, you can sort by label descending or you can sort on categories within the pie. For the function, you will not select a Sort Value. Click Apply.
|
|
. |
The pie chart is displayed. You can edit the chart or switch back to the report. Click View Report.
|
Create a Group By Report
This action is used to group data by a particular function or sort column. Perform the following steps:
|
. |
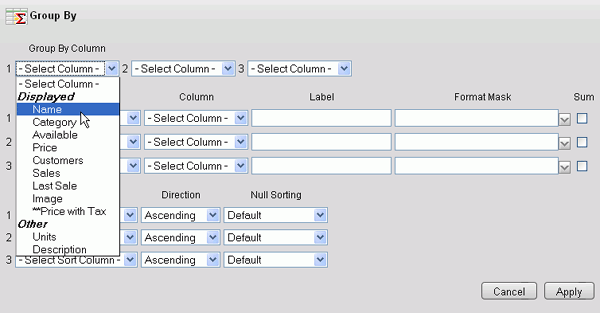
Click Actions and select Format > Group By.
|
|---|---|
. |
Select Name for the Group By Column.
|
. |
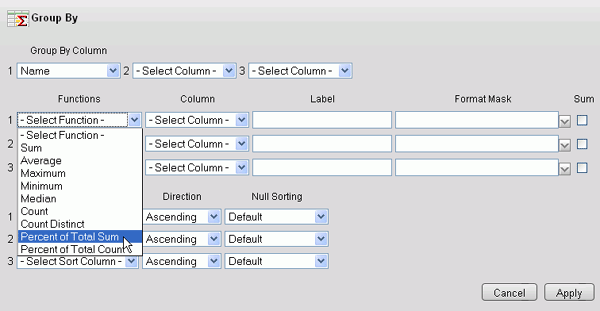
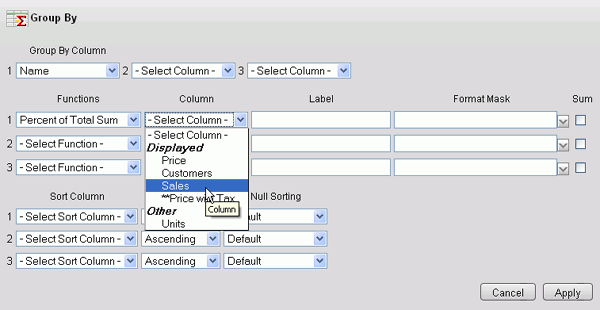
Select Percent of Total Sum for the Function.
|
| . |
Select Sales for the Functions Column.
|
. |
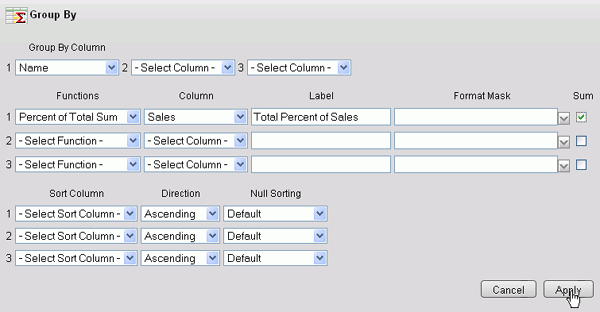
Enter Total Percent of Sales for the Label and click the Sum check box and click Apply.
|
|
. |
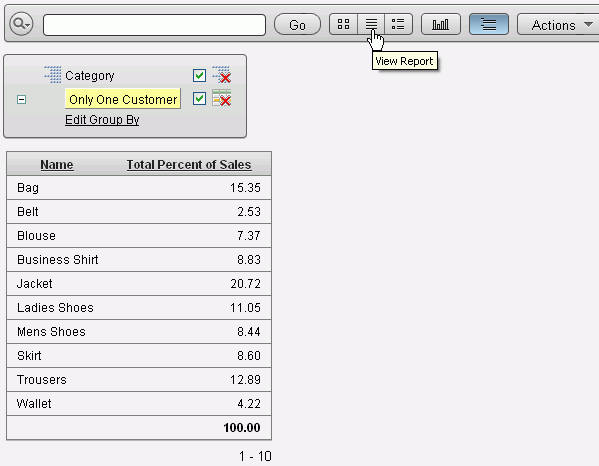
The Group By report is displayed. Notice that each product is listed with its percentage of the total sales. Click the View Report icon to return to your previous report.
|
Perform a Flashback Query
This action is used to view the data as it existed at a previous point in time. The default amount of time that you can flashback is 3 hours (or 180 minutes) but the actual amount will differ per database. Perform the following steps:
|
. |
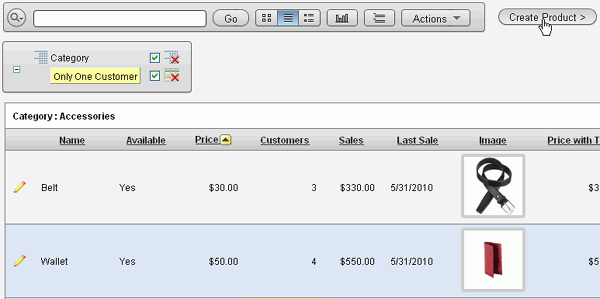
In order to show a flashback query, you need to make a change to the database first. Click Create Product.
|
|---|---|
. |
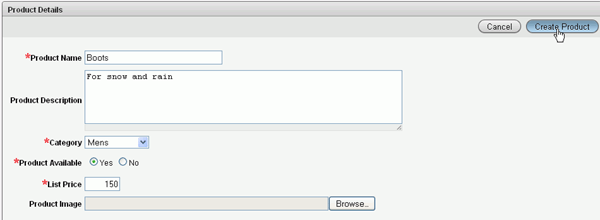
Enter Boots for the Product Name, Snow and rain for the Description, select Mens from the Category list, make sure Yes is selected for Product Available and 150 is entered for the List Price. Click Create.
|
. |
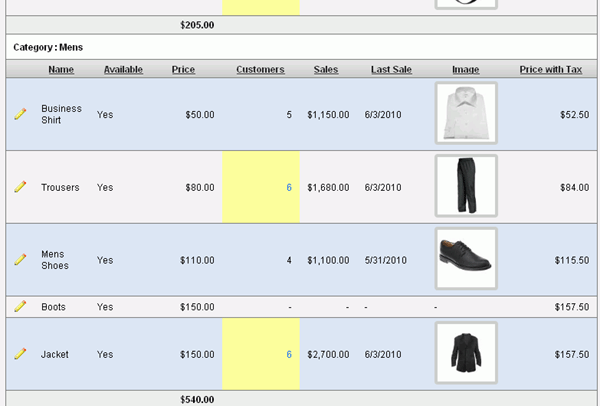
Scroll down to see the Boots product is now displayed in the report.
|
| . |
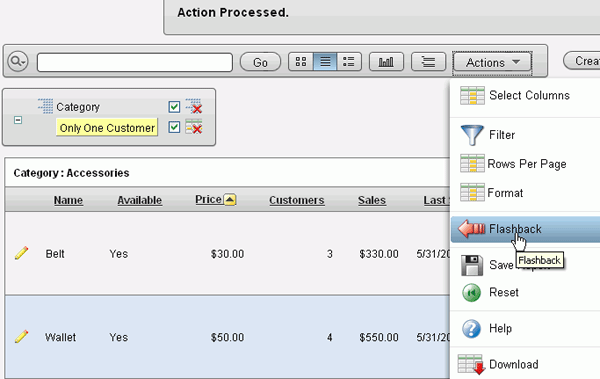
Click Actions and select Flashback.
|
. |
You want to show the data as of 5 minutes ago. Enter 5 in the field and click Apply.
|
|
. |
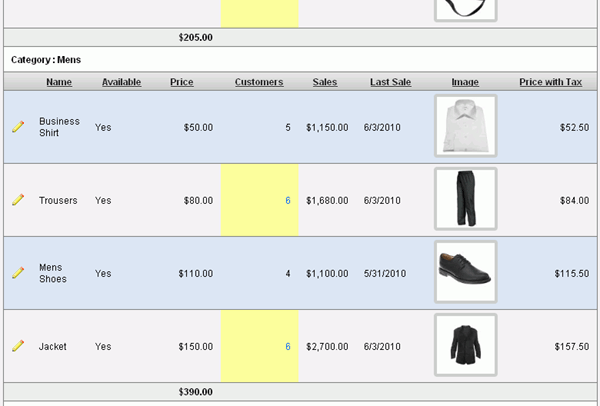
The flashback was applied and you do not see Boots in the list because it was created less than 5 minutes ago.
|
|
. |
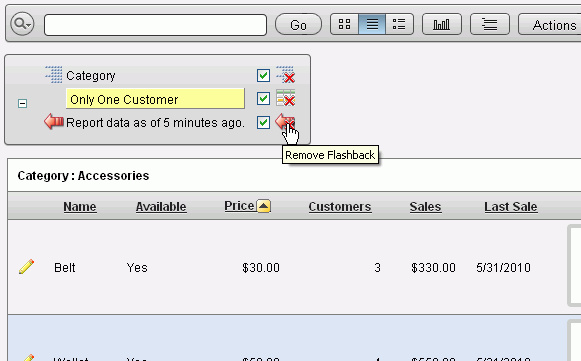
Scroll up and click the Remove Flashback icon.
|
|
. |
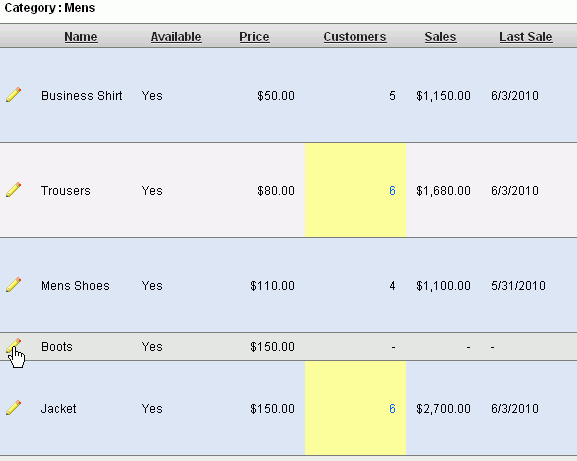
You want to clean up the data (for the other tutorials you may follow). Delete the product you just added. Select the edit icon in front of the Boots row.
|
|
. |
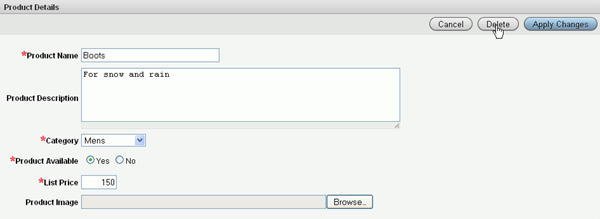
Click Delete.
|
|
. |
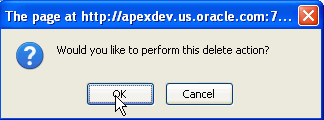
Click OK to confirm your deletion.
|
Saving a Report
This action is used to save the customized report for future use. You provide a name and an optional description. When navigating between pages in an application and then returning to the Products tab, your changes (filters, control breaks, etc.) will still be available. In APEX 4.1, you can save a report as a Public Report so that other authenticated users can see the report. You can also save Private Reports that only you may view. If you logout, your changes will not be saved unless you have saved the report. You can save multiple versions of a private or public report and each will appear in the list of reports. Perform the following steps:
|
. |
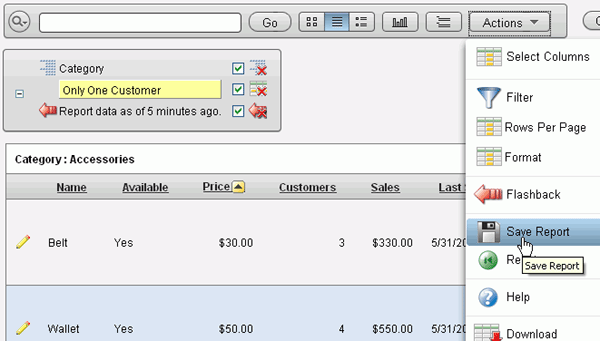
Click Actions and select Save Report.
|
|---|---|
. |
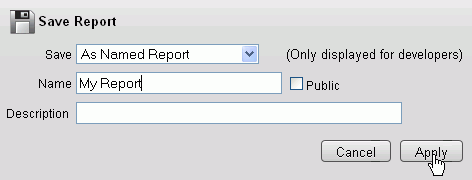
Enter a name for the report and click Apply. Note that you can create a Public report that can be accessed by all users if you click the Public check box. In this case, you want to just create a Private report that only you can view. If another user logs into the application, that user will not see your Private report.
|
. |
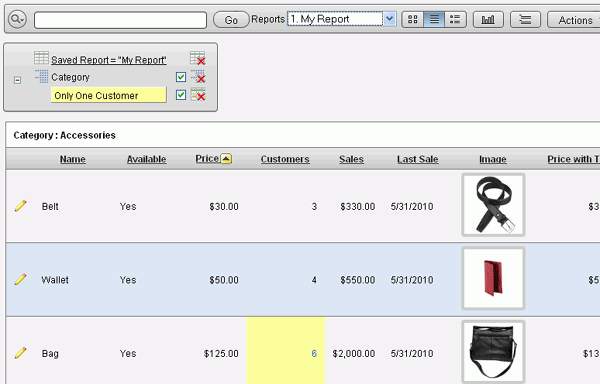
A drop down list in the Search Bar is automatically visible with the report you just created being selected.
|
|
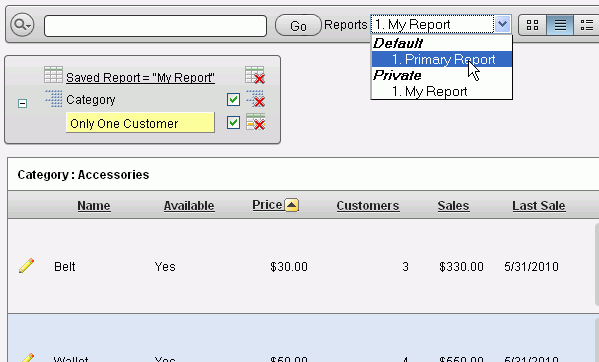
. |
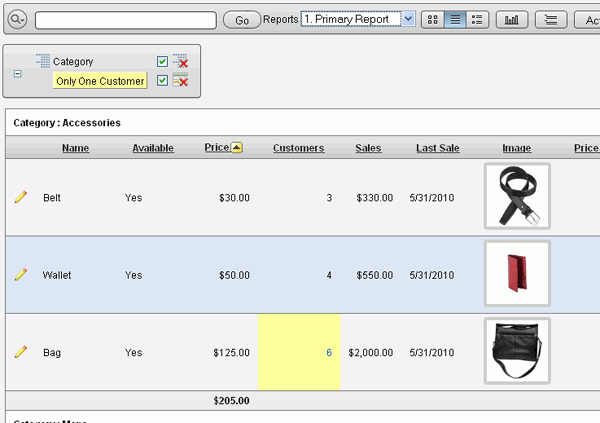
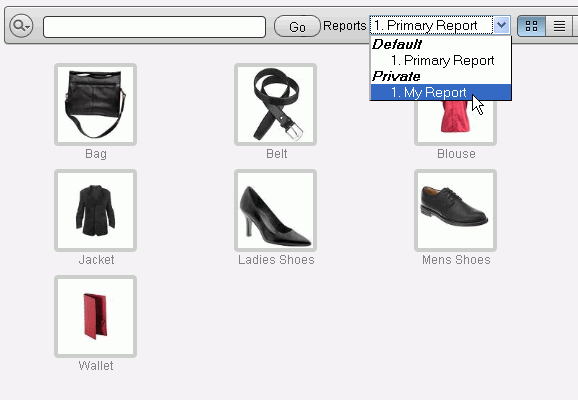
You can view the default primary report (which is a different report view). Select Primary Report from the Reports drop down list.
|
|
. |
The primary report is now displayed. You can make any changes to this report and it will not be reflected in the My Report private report you just created.
|
Resetting Defaults
This action is used to reset the report back to the default settings and remove any customizations that you have made. Perform the following steps:
|
. |
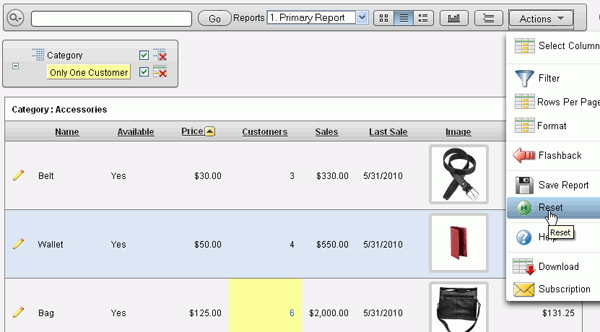
Click Actions and select Reset.
|
|---|---|
. |
Click Apply to confirm that you want the reset to be performed.
|
. |
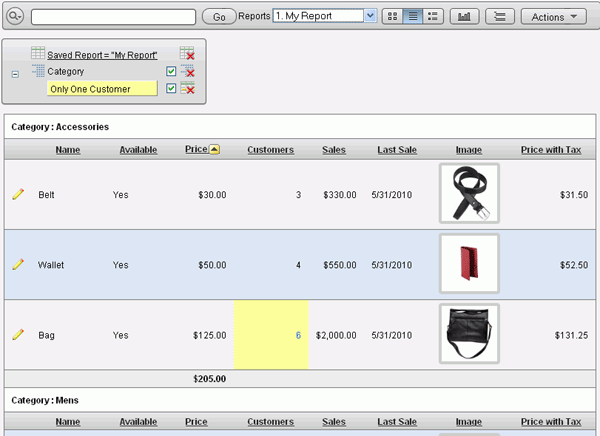
All the filters, control breaks, etc. have been lost and the report has been reset. Notice that your My Report private report is still in the list of Reports. Select My Report from the drop down list.
|
|
. |
The Saved Report changes are still intact.
|
Downloading Data in Different Formats
This action is used to download the current result set. The download formats will differ depending upon your installation and report definition but may include CSV, HTML, EMAIL, XLS, PDF, or RTF. Perform the following steps:
|
. |
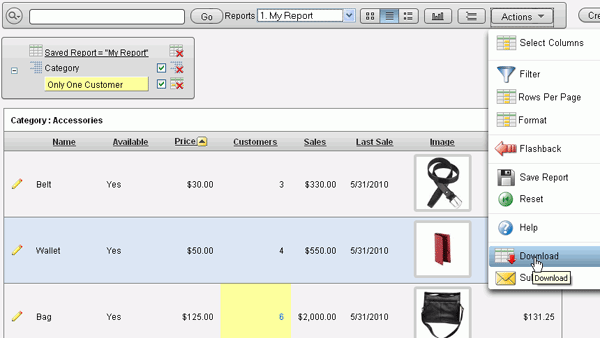
Click Actions and select Download.
|
|---|---|
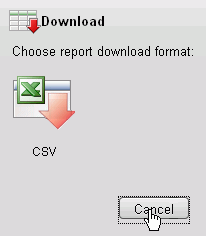
. |
The format is displayed. In order to see additional format types, they need to be enabled for this application. In this case, only the default CSV is enabled. Click Cancel.
|
Subscribing to a Report
This action is used to subscribe to a report that will be sent via email for a specified length of time. Perform the following steps:
|
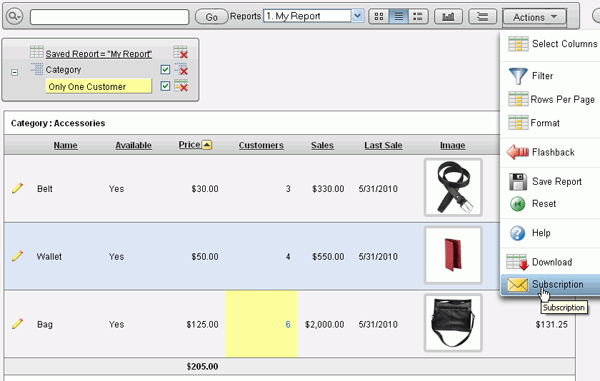
. |
Click Actions and select Subscription.
|
|---|---|
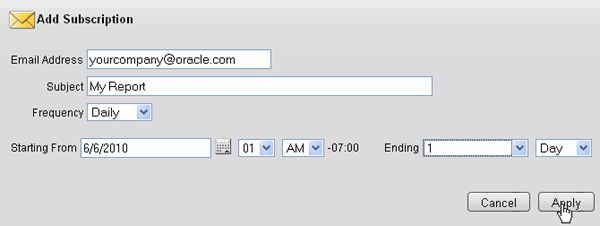
. |
Enter an email address and specify the starting date and ending day in number of days from the starting date. Then click Apply.
An email will be sent to the email address specified based on the time specified. In this case, at 1AM for one day.
|
Manipulating the Interactive Report Using the Column Heading Menu
Clicking any column heading exposes a column heading menu. Some of the functions on the Column Heading Menu can also be done using the Actions Menu. The Column Heading Menu contains the following functions:
Sorting Columns
You can sort on a particular column from the column header. Perform the following steps:
|
. |
Select the Primary Report from the Reports drop down list.
|
|---|---|
. |
Select the View Report icon.
|
. |
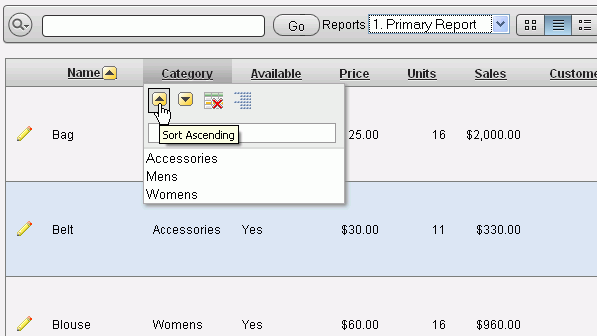
Select the Category Header and select the sort ascending
icon
|
. |
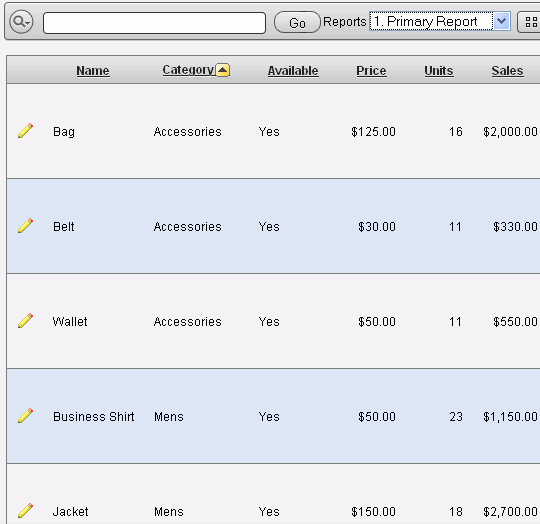
Notice that the sort ascending icon is now next to the Category header
indicating that this is the column that the report is currently sorted
on. Note that the sort descending icon works the same way as the sort
ascending icon
|
Hiding a Column
You can hide a particular column from the column header. Perform the following
steps:
|
. |
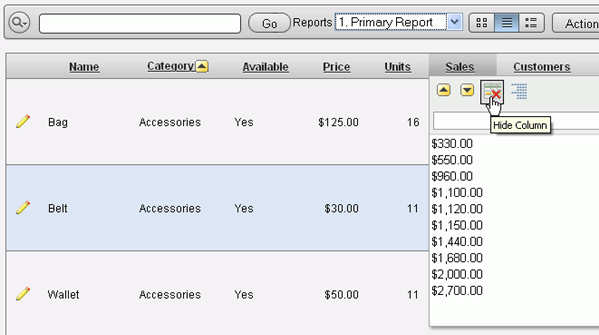
Select the Sales Header and select the Hide Column
icon
|
|---|---|
. |
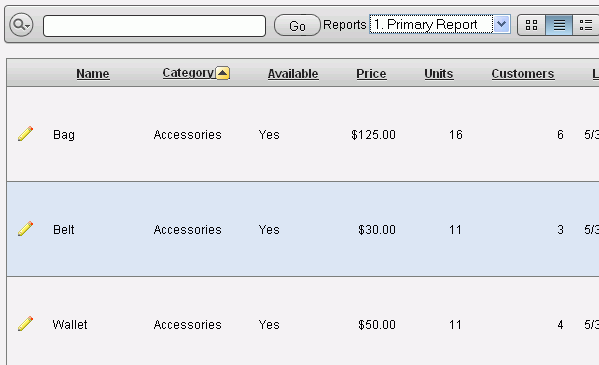
Notice that the Sales column no longer appears in the report. Note: To get the column back, use the Select Columns option from the Actions menu.
|
Creating a Control Break on a Column
You can break a particular column from the column header. When control break is created, the column becomes a master record for the report. Perform the following steps:
|
. |
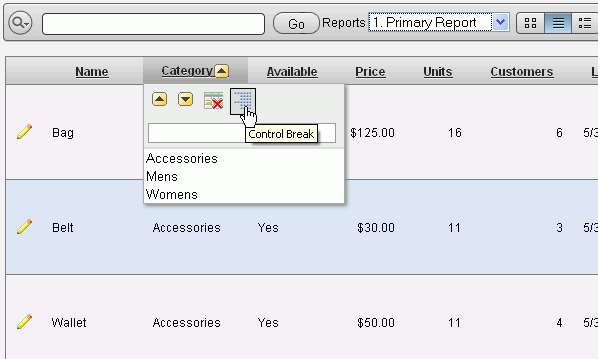
Select the Category Header and select the Control
Break icon
|
|---|---|
. |
The report now has a control break on the Category column.
|
Displaying Column Information
You can display Column Information about a particular column from the column header. The Column Information icon will only appear if there is help text defined for the column. This is defined by the developer who created the report. Perform the following steps:
|
. |
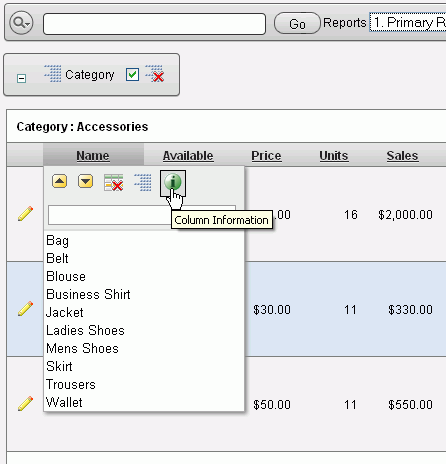
Select the Name Header and select the Column Information
icon
|
|---|---|
. |
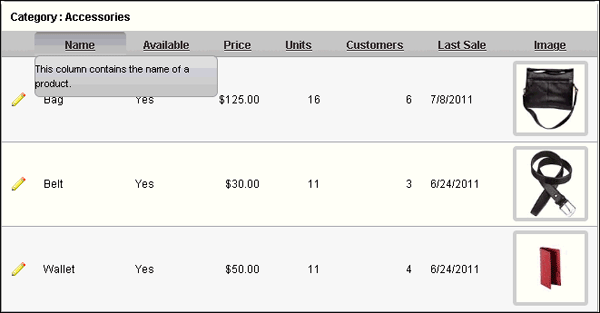
The Column Information is displayed.
|
Creating a Filter
The Text Area on the column header is used to enter case insensitive search criteria (no need for wild cards). Entering a value reduces the list of values at the bottom of the menu. You can select a value from the bottom and the selected value creates a filter using '=' (e.g. column = 'ABC'). Perform the following steps:
|
. |
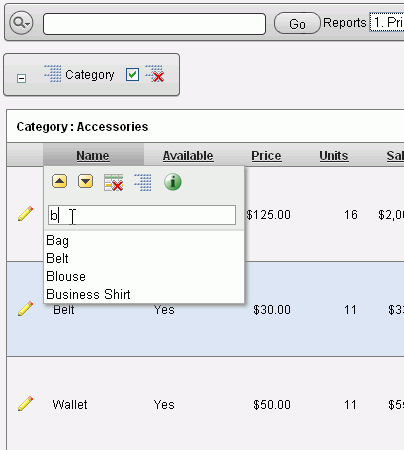
Select the Name Header and enter the letter b in the text area. Notice that the list of values changes as you type. Select the value you want to create a filter for.
|
|---|---|
. |
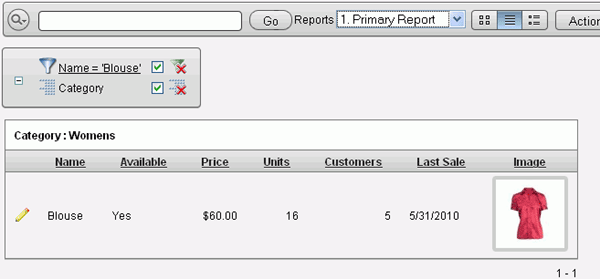
Notice that the filter is created.
|
Summary
In this tutorial, you learned how to:
- View a record in your report
- Search for information in your report
- Manipulate the interactive report using the actions menu
- Manipulate the interactive report using column headers
Resources
- Oracle Application Express homepage on OTN.
- Oracle Learning Library
- Oracle University
![]()
| Copyright © 2011, Oracle and/or its affiliates. All rights reserved | |
