Building Maps for Oracle Business Intelligence Analyses and Dashboards
Overview
- Have access to or have Installed Oracle Business Intelligence 11g.
- Use Enterprise Manager 11g Fusion Middleware Control to upload the OBIEEMAP repository (obieemap.rpd) located here. The repository password is welcome1. Please note that this repository will not be ready for building analyses in OBI Presentation Services until after you complete the first topic in this OBE: Importing Schemas to Your Database.
Purpose
This tutorial covers using Oracle Map Builder and Oracle Map Viewer to build and embed maps for use in Oracle Business Intelligence analyses and dashboards.
Time to Complete
Approximately 90 minutes
Introduction
In this Oracle by Example (OBE) tutorial you learn how to use Oracle Map Builder to build a map, use Oracle Map Viewer to bring the map online for integration with Oracle Business Intelligence (OBI), and then embed the map into a Map view in an OBI analysis. Please note that this tutorial provides only a basic introduction to Oracle Map Builder and Oracle Map Viewer for the purposes of building a map and then integrating the map into OBI. For more detailed information about Map Builder and Map Viewer, please refer to the Resources section at the end of this OBE.
Prerequisites
This tutorial uses a sample map data schema, a pre-built OBI schema, and a pre-built OBI repository. All instructions for accessing and importing the schemas are provided in this tutorial. This tutorial does not provide instructions for uploading the pre-built OBI repository. It is assumed that you know how use Enterprise Manager 11g Fusion Middleware Control to upload an OBI repository. Please note that this tutorial was built using a Windows environment with all required components installed on a single machine. As a result you may need to modify some steps in this tutorial to match your environment. Before starting this tutorial, you should:
Importing Schemas to Your Database
To import the required schemas for this OBE into your Oracle database, perform the following steps. In this tutorial you use a Map Viewer demo schema, mvdemo, and an OBI schema, obieemap. All instructions for accessing and importing these schemas are provided in this tutorial.
Sign in to SQL*Plus as a system user and create a database user named mvdemo. Use the following script for reference:
CREATE USER mvdemo IDENTIFIED BY mvdemo DEFAULT TABLESPACE USERS;

Grant privileges to the mvdemo user. Use the following script for reference:
GRANT CONNECT, RESOURCE, CREATE VIEW TO mvdemo IDENTIFIED BY mvdemo;

Copy mvdemo.dmp to a location on your machine. In this example mvdemo.dmp is copied to D:\mvdemo\mvdemo11R1. This is a database dump file exported from an Oracle database. You can import it into an Oracle 10g or 11g database.
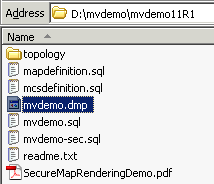
Open a command window, change the directory to the location of mvdemo.dmp, and use the following command to import the data into user mvdemo:
imp mvdemo/mvdemo file=mvdemo.dmp full=y ignore=y

If the above command fails due to character set related issues (such as IMP-00016 imp: charset conversion error), you may need to set the NLS_LANG environment variable to American_America.WE8ISO8859P1 temporarily. For instance, on Windows you can type the following in the DOS window before issuing the above imp command again:
set NLS_LANG=American_America.WE8ISO8859P1
You can ignore all other warnings from the imp command, including one that says "Unexpected end of export file encountered". The imported data is ready to be used.
Verify the import. Connect as mvdemo and use the following script as a reference:
select table_name from user_tables;
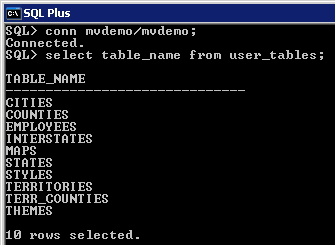
Verify if the script mcsdefinition.sql has been run in your database. If not, run the script mcsdefinition.sql.
Explanation: If your database has never run this script before, you will need to run it as DBA role. To verify if this script has been run, you can log into the database (as any user), and execute the following query:
select name from user_sdo_cached_maps;

If the query produces an error that says "table or view does not exist" then this script has never been run on the database. If it does not return such an error (even if no rows were selected as shown in the screenshot), then you do not need to run the script mcsdefinition.sql.
If you do need to run this script, simply log on as a DBA, and execute the script. It will create the view USER_SDO_CACHED_MAPS for all users. This view is used to hold the map tile layer definitions and is required by Map Viewer.
Unzip mvdemosql.7z and then copy mvdemo.sql to a location on your machine. In this example mvdemo.sql is copied to D:\mvdemo\mvdemo11R1. Run mvdemo.sql. This script populates all the necessary spatial metadata, copies the predefined styles, themes, and base maps into the proper user views, and creates spatial indexes for the imported tables. It also creates several (cached) map tile layer definitions in the view USER_SDO_CACHED_MAPS so that all the Oracle Maps tutorials will work. Here is how to run the script from a SQL*Plus session while logged in as user mvdemo:
SQL> @D:/mvdemo/mvdemo11R1/mvdemo.sql

To verify that the script has run successfully, run the SQL command select count(*) from user_sdo_maps and confirm that four rows are returned.

Sign in to SQL*Plus as a system user and create a database user named obieemap. Use the following script for reference:
CREATE USER obieemap IDENTIFIED BY obieemap DEFAULT TABLESPACE USERS;

Grant privileges to the obieemap user. Use the following script for reference:
GRANT CONNECT, RESOURCE, CREATE VIEW TO obieemap IDENTIFIED BY obieemap;

Copy obieemap.dmp to a location on your machine. In this example obieemap.dmp is copied to D:\obieemap. This is a database dump file with OBI data exported from an Oracle database. You can import it into an Oracle 10g or 11g database.

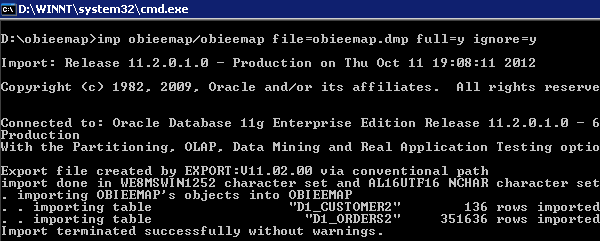
Open a command window, change the directory to the location of obieemap.dmp, and use the following command to import the OBI data into user obieemap:
imp obieemap/obieemap file=obieemap.dmp full=y ignore=y
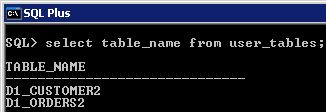
Verify the import. Connect as obieemap with password obieemap and use the following script as a reference:
select table_name from user_tables;
Creating a Map Viewer Data Source
To create a Map Viewer data source, make sure your Oracle database is up and then perform the following steps.
Open a browser and enter the following URL to connect to Map Viewer: http://host:port/mapviewer. For example: http://localhost:7001/mapviewer.
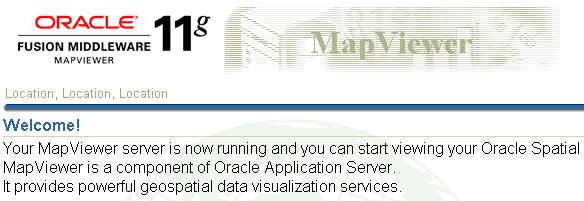
Click the Admin link in the upper right corner to open the Login screen.

On the Login screen, enter your OBIEE administrative username and password. In this example the username is weblogic.
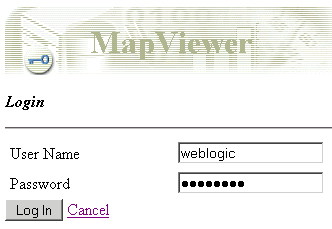
Click Log In to open the Map Viewer Administration screen.
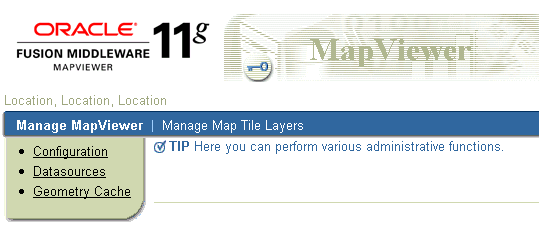
Select Management > Configuration to open the Map Viewer XML configuration file inside a text area.

Scroll all the way down to the end of the file to find the sample Map Viewer data source definition: map_data_source name=.
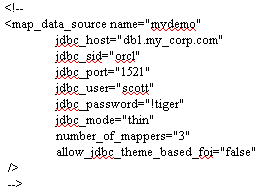
By default map_data_source name= should point to "mvdemo". If not, change it to map_data_source name="mvdemo". Uncomment the data source definition by removing the XML comment tags, and then modify the database connection and login information to reflect your mvdemo schema. Use the screenshot as a reference. Make sure you have an exclamation point “!” in front of the supplied login password value. Then next time you restart Map Viewer it will automatically obfuscate this password.
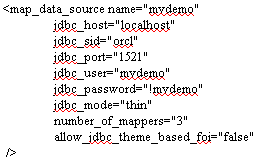
Click on the Save & Restart button underneath the text area. Map Viewer will restart, reload this configuration file, and the mvdemo data source will be created (make sure the database and its listener are both up!).

At the top of the page, in the Information section, verify that mapViewerConfig.xml has been saved and Map Viewer has been restarted.

Select Datasources. In the top panel under Existing Data Sources it should list the mvdemo data source.

Installing and Configuring Map Builder
To install and configure Map Builder, perform the following steps:
Copy mapbuilder.jar to a location on your machine. In this tutorial the file is copied to D:\MapBuilder.

Double-click mapbuilder.jar to open the Oracle Map Builder user interface.
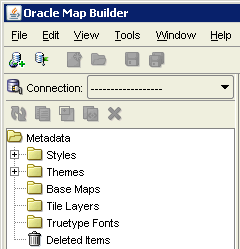
Expand the Connection drop-down list and select Load/Add/Remove to open the Load/Add/Remove Database Connections dialog box.
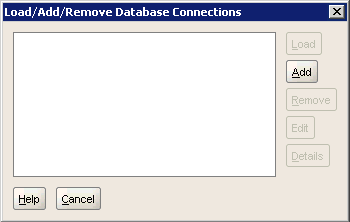
Click Add in the Load/Add/Remove Database Connections dialog box to open the Add Connection dialog box.
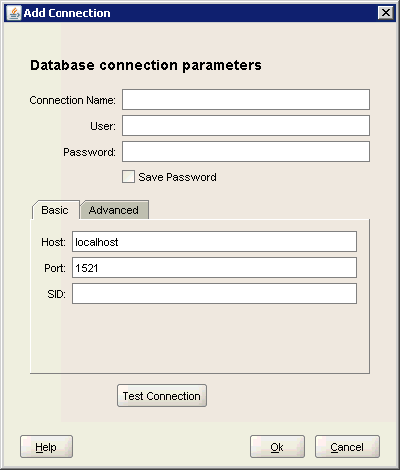
Enter the connection information for your environment. Use the screenshot for reference. For the environment used to build this tutorial, the information is:
Connection Name: mvdemo
User: mvdemo
Password: mvdemo
Host: localhost
Post: 1521
SID: orcl
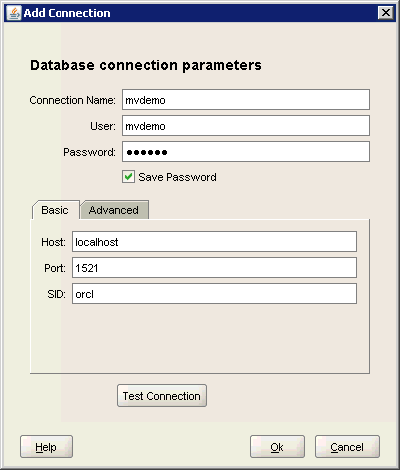
Click Test Connection. You should receive the message "Connection mvdemo is valid".
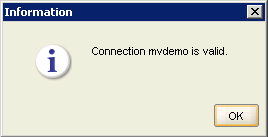
Click OK to close the Information message.
Click OK to close the Add Connection dialog box. You should receive the following message in the Map Builder Messages pane:

Creating a Color Style
In this set of steps you use Map Builder to create a color style for rendering the States table. Styles are used to render and label spatial features. Color styles can be used to render area, linear and point features.
Expand Styles > Colors in the Metadata Navigator tree. Notice that Oracle Map Builder is now populated with the mvdemo metadata. Although you could use this pre-built metadata to build your map, in the remainder of this OBE you create new metadata to become familiar with using Oracle Map Builder.

Right-click the Colors node and select Create Color Style to open an editor panel for Color Style on the right.
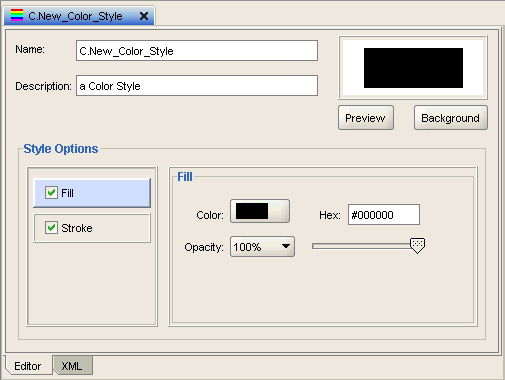
Select the Fill option under Style Options. The fill attribute defines how the geometry will be filled.
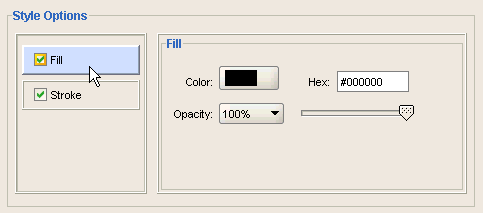
Define the fill color by clicking on the color icon to open a dialog with colors, or by entering the hexadecimal value. In this example we enter the hexadecimal value #F2EFE9, which is a light gray color.
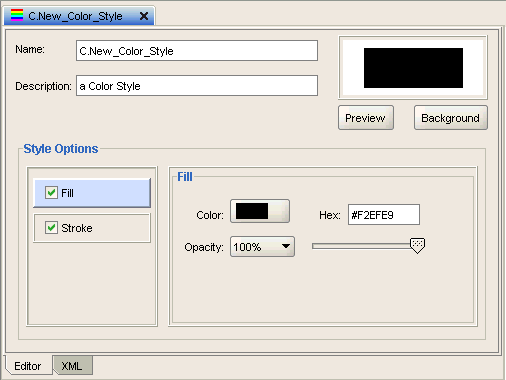
Select the Stroke option. The stroke defines how the outline (border) will be rendered. In this example enter #0033FF in the Hex box to set the stroke color to Blue.

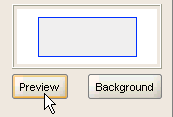
Click the Preview button to display the current color style representation.
Enter C.STATES in the Name text field. Leave the optional description text field as it is.

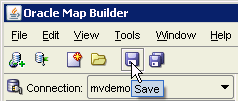
Click the Save icon on the application tool bar to store the color style definition on the USER_SDO_STYLES database view.
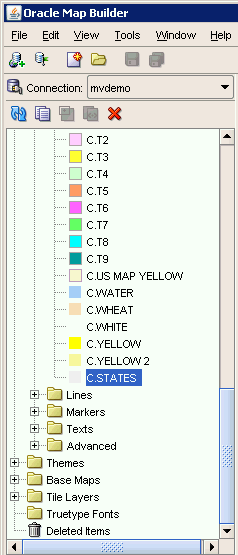
Expand the Colors node in the Metadata Navigation tree and confirm that the tree is updated with this new C.STATES color style.
Creating a Marker Style
In this set of steps you use Oracle Map Builder to create a marker style for rendering cities. Marker styles can be used to render point features, and to label linear and point features. The base marker can be associated with an image, with a vector representation, or with a true type font.
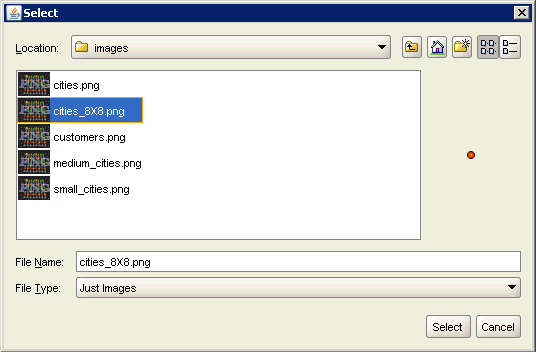
Copy cities_8X8.png to a location on your machine. In this tutorial the file is copied to D:\mvdemo\images.
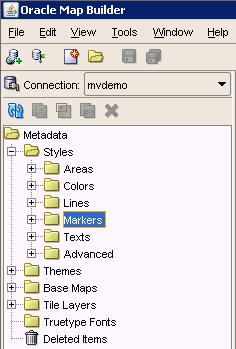
Expand Styles > Markers in the Metadata Navigator tree.

Right-click the Markers node and select Create Marker Style to open an editor panel for Marker Style on the right.
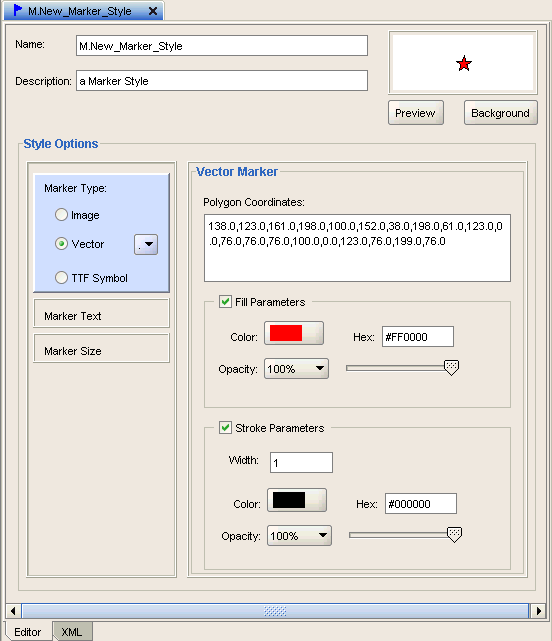
Under Style Options, select the Marker Type option and click on the Image radio button.
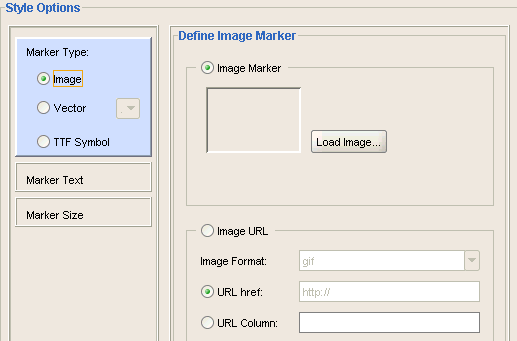
Click Load Image, navigate to the directory where file cities_8x8.png is located, and select it. In this OBE image file is located in D:\mvdemo\images.
Click the Preview button to display the current marker style representation.
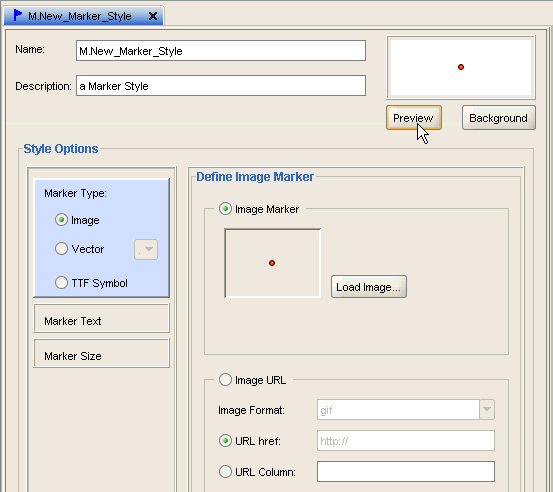
Enter M.CITIES in the Name text field. Leave the optional description text field as it is.
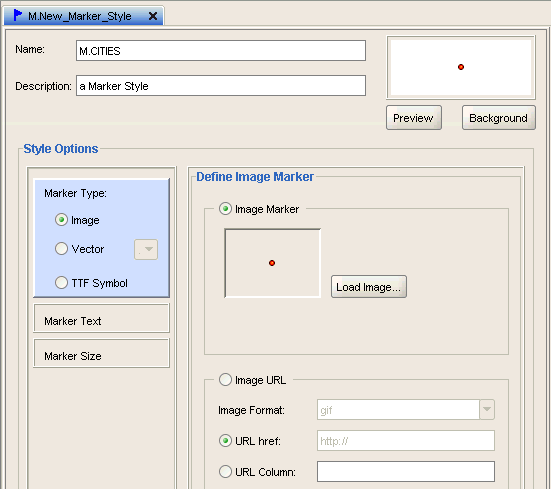
Click the Save icon on the application tool bar to store the marker style definition on the USER_SDO_STYLES database view.

Expand the Markers node in the Metadata Navigation tree and confirm that the tree is updated with this new M.CITIES marker style.

Creating a Text Style
In this set of steps you use Oracle Map Builder to create two text styles, one for displaying city names and the other for state abbreviations.
Expand Styles > Texts in the Metadata Navigator tree.
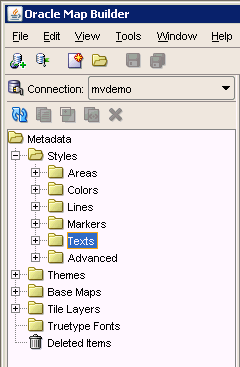
Right-click the Texts node and select Create Text Style to open an editor panel for Text Style on the right.
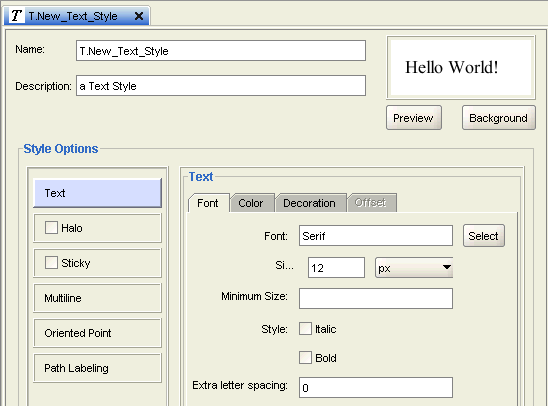
Under Style Options, select the Text style option.
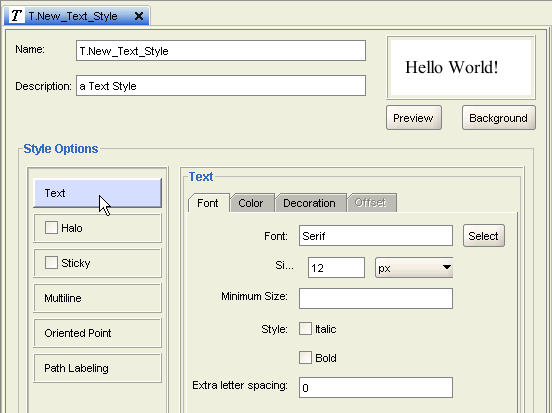
Change the font to Dialog, font size to 12, and style to Bold.

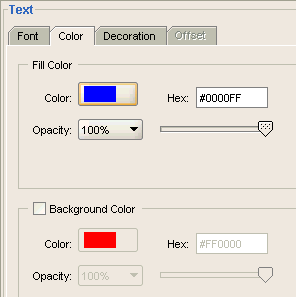
Select the Color tab and change the fill color to #0000FF (RGB: 0, 0, 255, blue). Leave Background color unchecked.
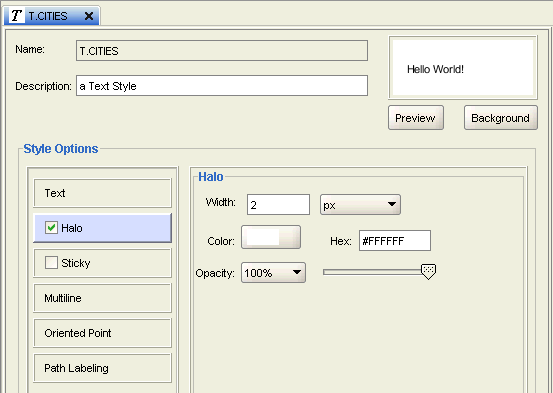
Click on the Halo option and set width to 2 and Color to #FFFFFF (white).
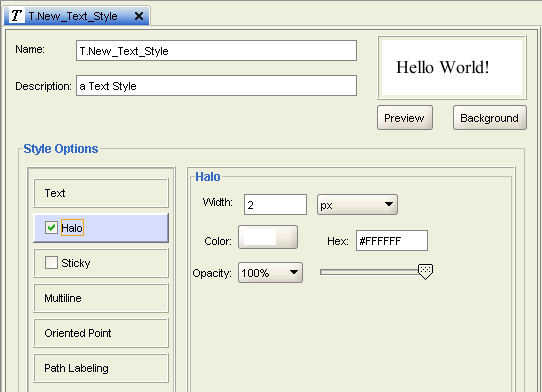
Click the Preview button to see the current text style representation.

Enter T.STATE_ABBRV in the Name text field.
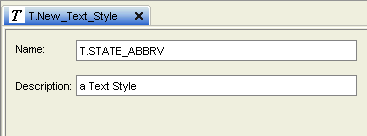
Click the Save icon on the application tool bar to store the text style definition in USER_SDO_STYLES database view.

Repeat the steps to create and save a text style named T.CITIES. Set the font to Dialog, size 11, and color to #000000 (black). Select the Halo option and set width to 2 and color to #FFFFFF (white).
Creating a States Theme
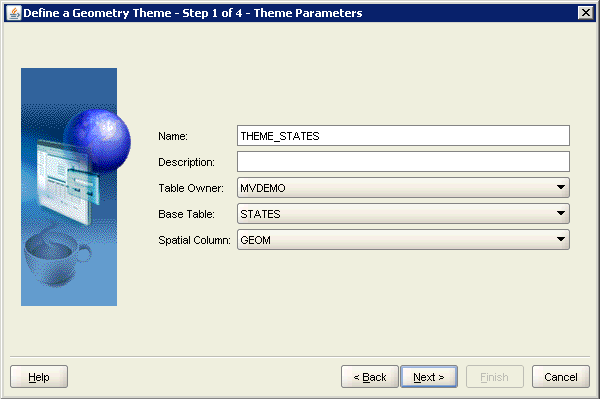
In this set of steps you use Oracle Map Builder to create a geometry theme based on the STATES table. A theme is a visual representation of a particular data layer. Typically, a theme is associated with a spatial geometry layer, that is, with a column of type SDO_GEOMETRY in a table or view. In this example, a geometry theme named THEME_STATES is associated with a spatial column named GEOM in the STATES table in the mvdemo schema.
If necessary, click the Show Data button at the bottom of the screen to display the Data Navigator.

Click the Tables tab.
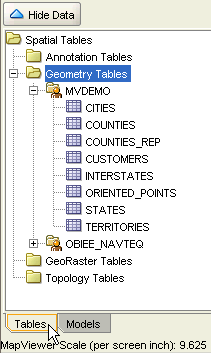
Expand Spatial Tables > Geometry Tables > MVDEMO.
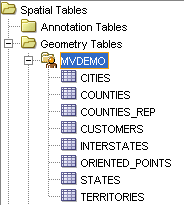
Right-click the STATES node and select Create Geometry Theme to open the Define a Geometry Theme wizard. Click Next to continue.

Notice that the Theme Parameters page is already populated with information obtained from the STATES table. Define the theme name as THEME_STATES and keep the other field values. Press Next to continue.
On the Feature Style page, keep the style type as Color, and type C.STATES in the render style field or click the Select button to choose the C.STATES style. Recall that you created the C.STATES style earlier in this OBE. Click Next to continue.

In the Style Picker Dialog, you define the label parameters. Check the Label Style box to enable the fields. Define T.STATE_ABBRV as the text style and select STATE_ABRV as the label column. Click Next to continue.

Define query conditions to be applied. In this case, leave it blank, which means that all features within the current map extent will be selected. Press Next to continue.

This last page contains the summary information for the theme that will be stored in USER_SDO_THEMES database view.
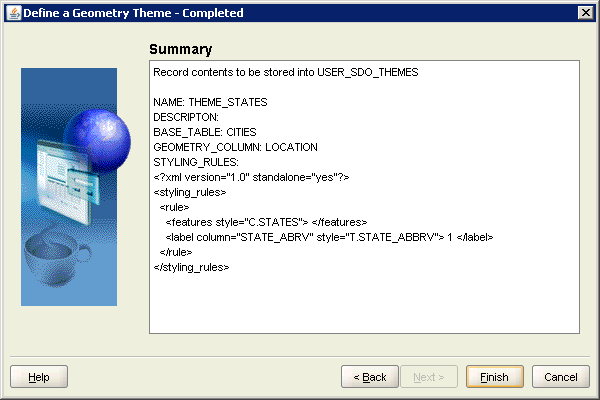
Press Finish to end the wizard. The theme editor page open on the right side of the application.
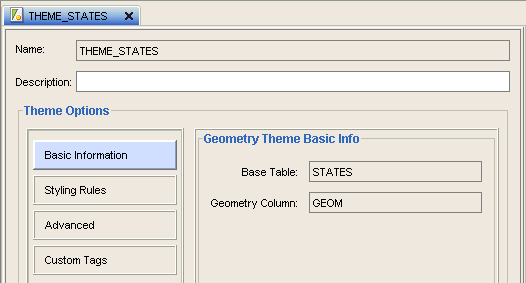
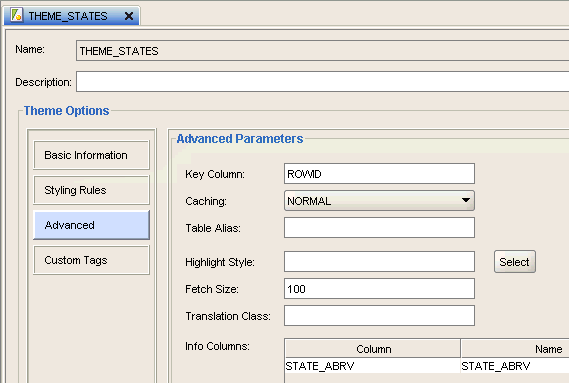
Click Advanced under Theme Options to open the Advanced Parameters screen on the right.

Click the Edit button (pencil icon) to open the Edit Info Columns dialog. You may need to scroll down to see the Edit button.
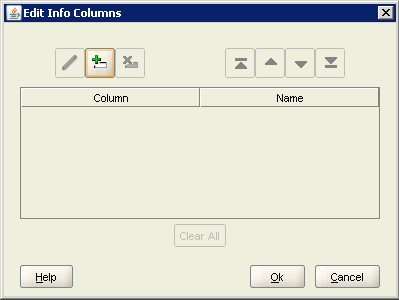
Click the Add a new row button (green plus sign) to add a new table row.
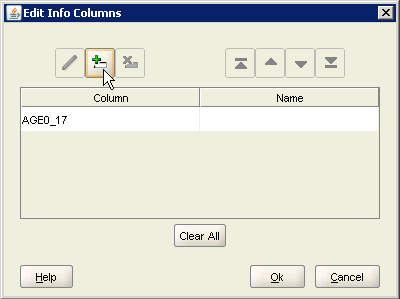
In the Column field, select STATE_ABRV and then enter STATE_ABRV in the Name field. The column must be exact, but the name is arbitrary and can be any value.
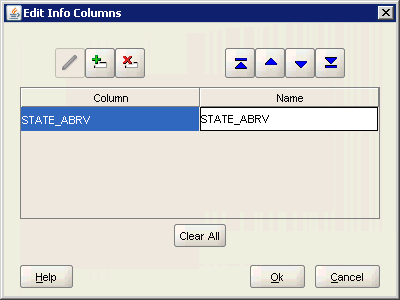
Click OK to close the Edit Info Columns dialog. The column/name pair is added to the THEME_STATES geometry theme. This is the most critical step for OBI integration. You defined the unique key column in the map data (STATE_ABRV) that will align with an OBI presentation attribute. Later in this OBE you complete this integration using the OBI Presentation Services Administration page.
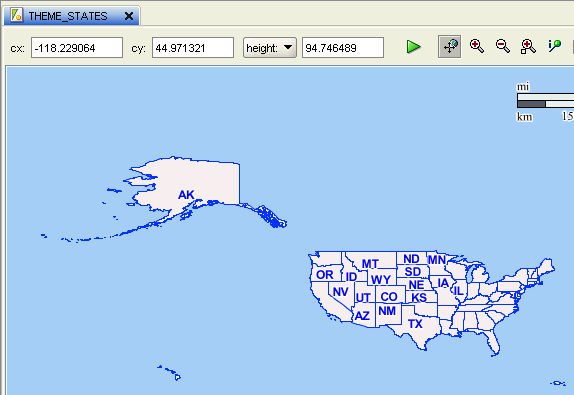
Select the Preview tab at the bottom of the page and click the green arrow to display data for this theme. Your results should look similar to the screenshot. If desired, use zoom controls to adjust the preview.
Click the Save button to save THEME_STATES.

Creating a Cities Theme
In this set of steps you use Oracle Map Builder to create a geometry theme based on the CITIES table.
If necessary, click the Show Data button at the bottom of the screen to display the Data Navigator.

Click the Tables tab.

Expand Spatial Tables > Geometry Tables > MVDEMO.

Right-click the CITIES node and select Create Geometry Theme to open the Define a Geometry Theme wizard. Click Next to continue.

Notice that this Theme Parameters page is already populated with information obtained from the CITIES table. Define the theme name as THEME_CITIES and keep the other field values. Press Next to continue.

On the Feature Style page, set the style type as Marker and M.CITIES as the render style. Recall that you created the M.CITIES style earlier in this OBE. Click Next to continue.
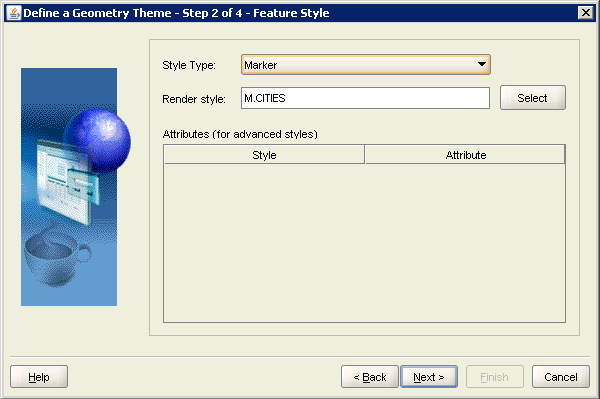
In the Style dialog, check the Label Style box to enable the fields. Define T.CITIES as the text style and leave the attribute as CITY. Click Next.

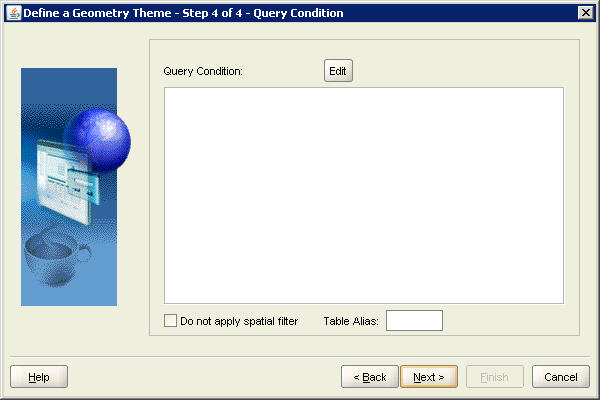
In the Query Condition dialog box leave the query condition blank and click Next to continue.
This last page contains the summary information for the theme that will be stored in USER_SDO_THEMES database view. Review the XML definition of the theme so far.
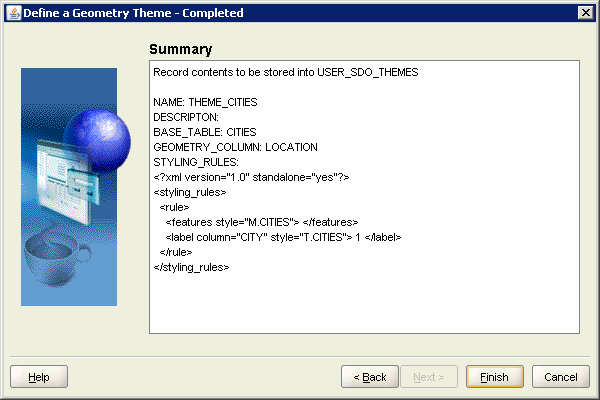
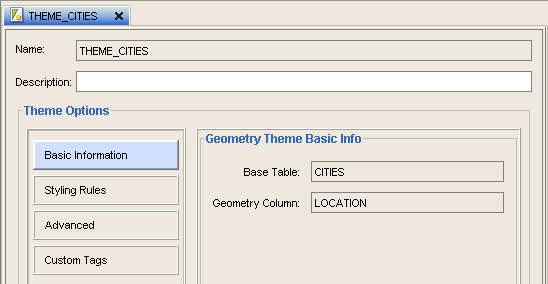
Press Finish to end the wizard. The theme editor page open on the right side of the application.
Click Advanced under Theme Options.
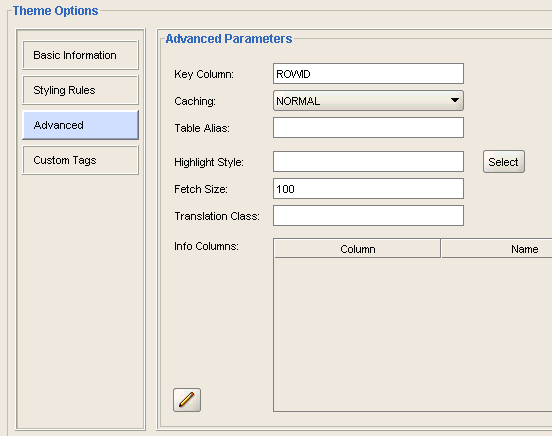
Click the Edit Info Columns button (pencil icon) to open the Edit Info Columns dialog.
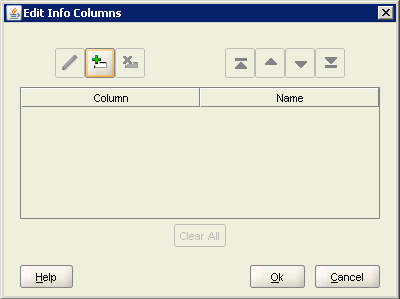
Click the Add a new row button (green plus sign) to add a new row.
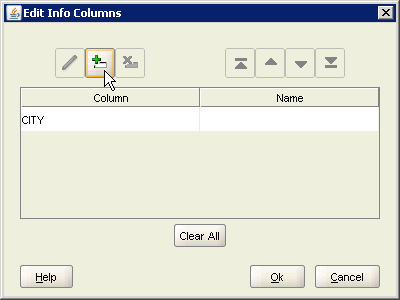
In the Column field, select CITY and then enter City in the Name field.
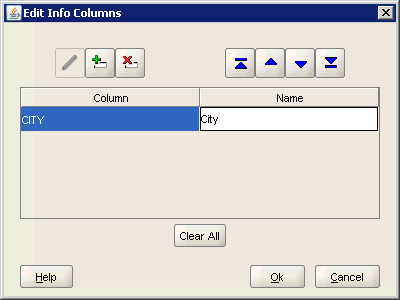
Click OK to close the Edit Info Columns dialog. The column/name pair is added to the THEME_CITIES geometry theme. Again, this is the most critical step for OBI integration. You defined the unique key column in the map data (CITY) that will align with an OBI presentation attribute. Later in this OBE you complete this integration using the OBI Presentation Services Administration page.
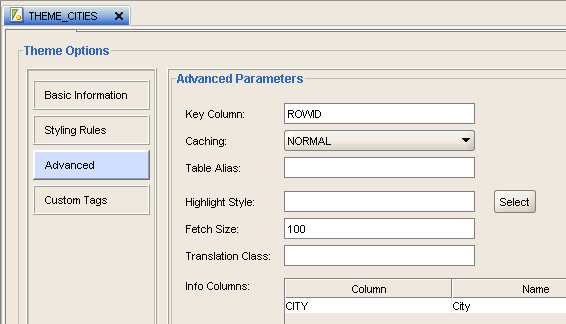
Select the Preview tab (at the bottom) and click the green arrow to render the cities with labels. Your results should look similar to the screenshot. If desired, use zoom controls to adjust the preview.
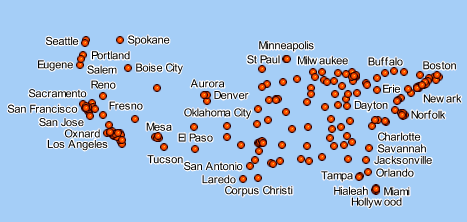
Click the Save button on the Toolbar to save the theme definition.

Creating a Base Map
In this set of steps you use Oracle Map Builder to create a base map. Base map definitions are stored in USER_SDO_MAPS and consist of one or more themes to be used in rendering a map. You use a wizard to create base maps in Map Builder.
Right-click the Base Maps node in the Metadata Navigator and then select Create Base Map to open the Define a Base Map Wizard. Click Next to continue.
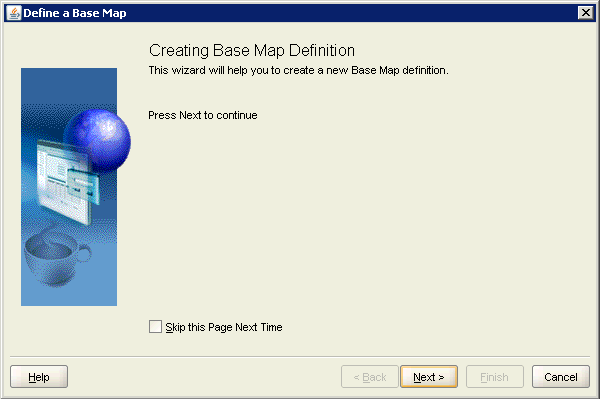
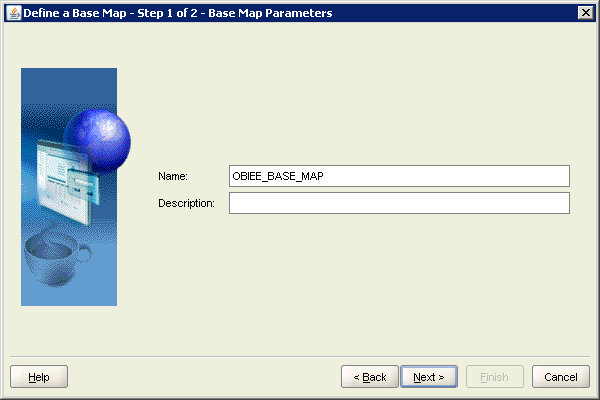
Enter OBIEE_BASE_MAP as the base map name. Click Next to continue.
In the Base Map Themes dialog, use the Add button to select THEME_CITIES and THEME_STATES from the table to add them to the base map.
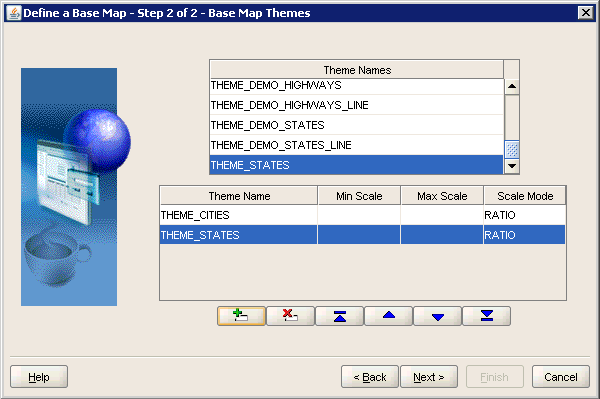
Enter the following scale ranges for the themes:
THEME_CITIES: Min Scale: 75,000,000 Max Scale: 0
THEME_STATES: Min Scale: 150,000,000 Max Scale: 0
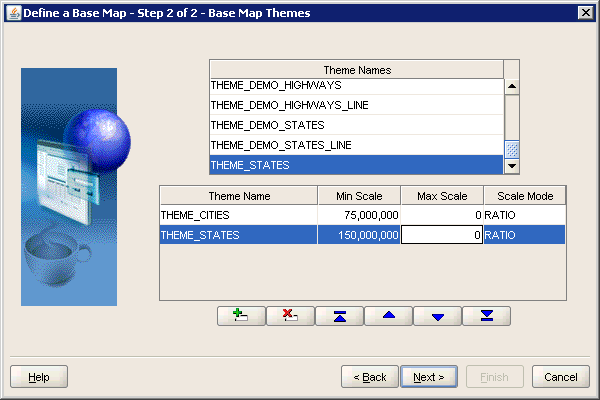
Click Next to open the Summary page.
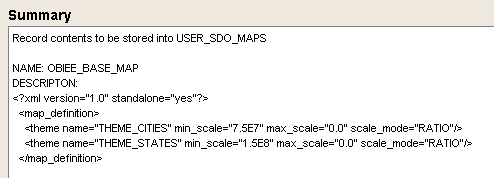
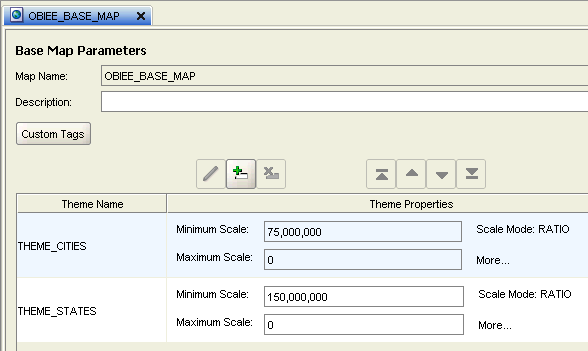
Click Finish to store the Base Map definition and display the editor page.
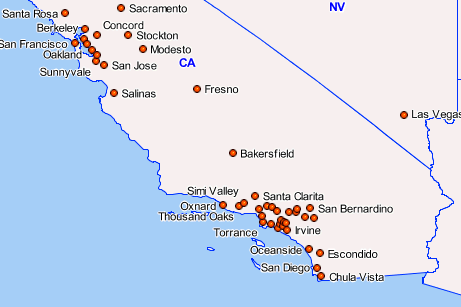
Select the Preview tab and click the green button to display the map. Note at the bottom of Map Builder application the scale values for current visualization. The resulting map should contain just the themes that are in the scale range. Play with the zoom in and zoom out options to see the map results. The screenshot shows the map zoomed in to California.
Creating a Tile Layer
In this set of steps you use Oracle Map Builder to create a tile layer. A tile layer is a map definition to be used in an Oracle Maps application. Each tile layer is associated with a base map. Please note that the steps for creating a tile layer can also be performed using the Map Viewer Admin interface. However, that method is not presented in this tutorial.
Right-click the Tile Layers node in the Metadata Navigator and then select Create Map Tile Layer to open the Select Base Map dialog.
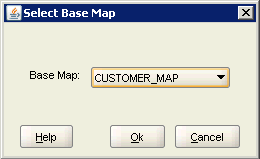
Select OBIEE_BASE_MAP as the base map.
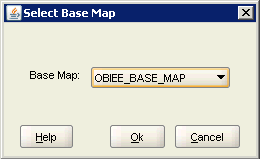
Click OK to open the Define a Map Cache Instance wizard. The wizard helps you create a new tiled layer to be used in Oracle Maps.
Click Next to open the Tile Layer Definition dialog.
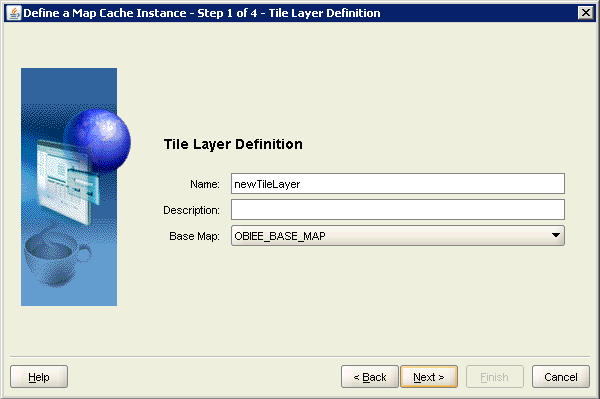
Name the tile layer OBIEE_TILE_LAYER.
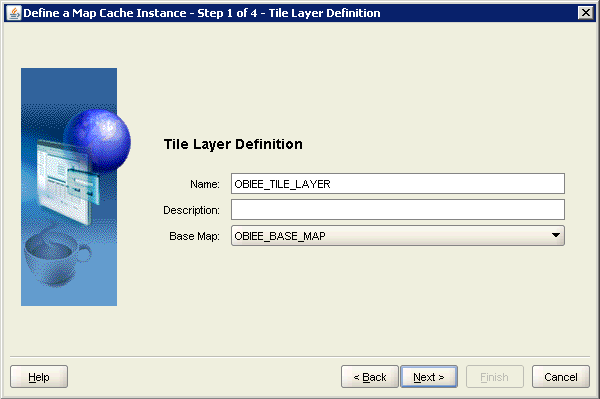
Click Next to open the Tile Layer Boundary and Zoom Levels dialog.
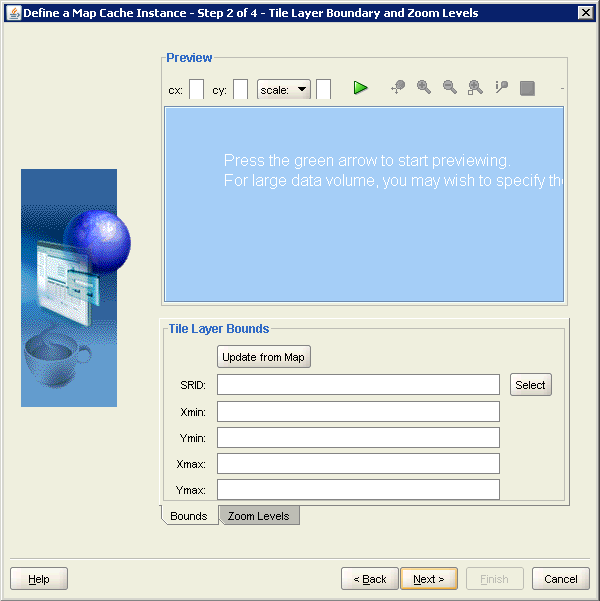
Click the green arrow to preview the map.
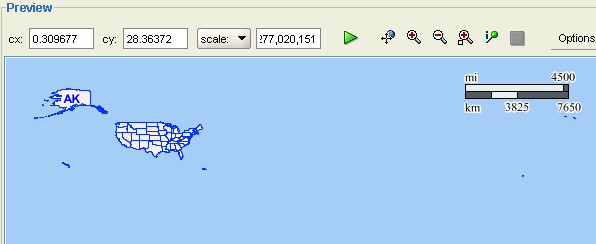
Use the zoom buttons to zoom in on the map until it looks similar to the screenshot:
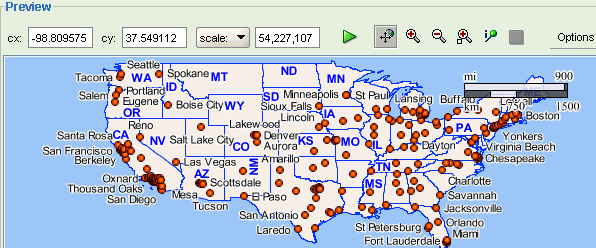
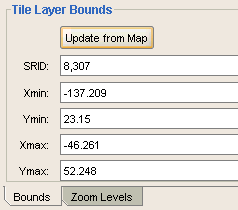
The Bounds tab should be selected by default. If not, select it. Click the Update from Map button to import tile layer bounds from OBIEE_BASE_MAP as it appears in the Preview pane. Your results will vary, but they should look similar to the screen shot.
Click the Zoom Levels tab.
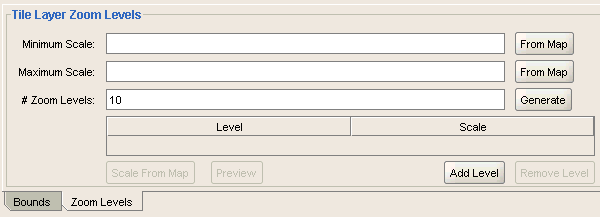
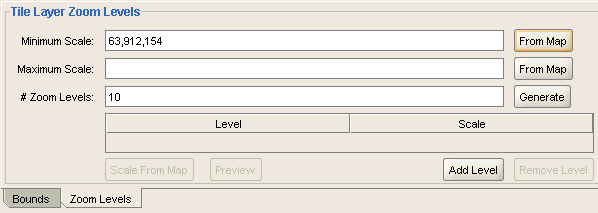
Click the From Map button for Minimum Scale to import the tile layer zoom level from OBIEE_BASE_MAP as it appears in the Preview pane.
Use the zoom buttons to zoom in on the preview map to the desired maximum scale. Use the screenshot as a reference.
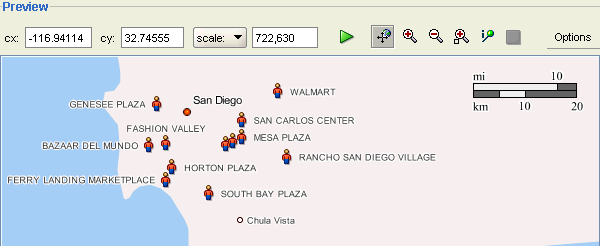
Click the From Map button for Maximum Scale to import the tile layer zoom level from OBIEE_BASE_MAP as it appears in the Preview pane.
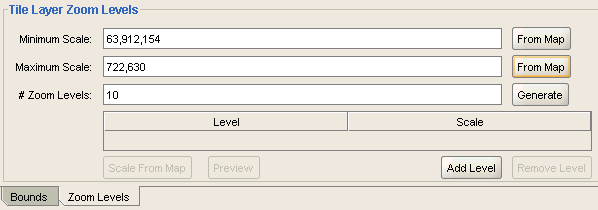
Leave # Zoom Levels set to the default (10) and click the Generate button to generate the zoom levels.
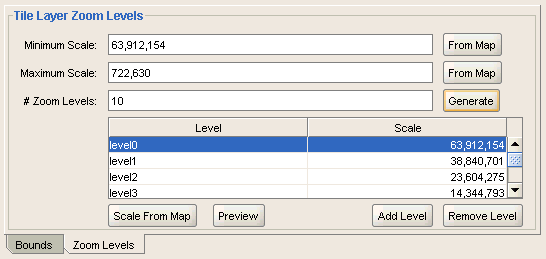
Click Next to open the Tile Properties dialog.
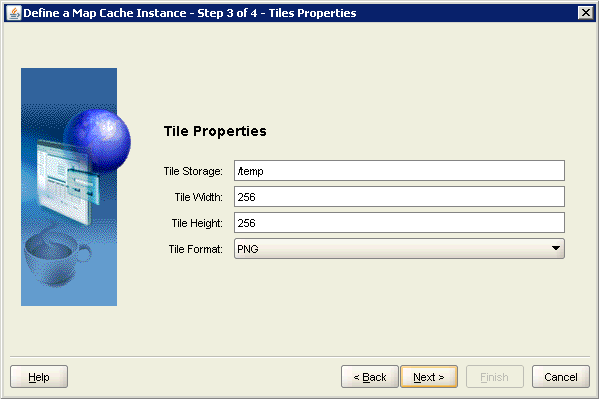
Leave the default properties as they are and click Next to open the Tile Rendering Hints dialog.
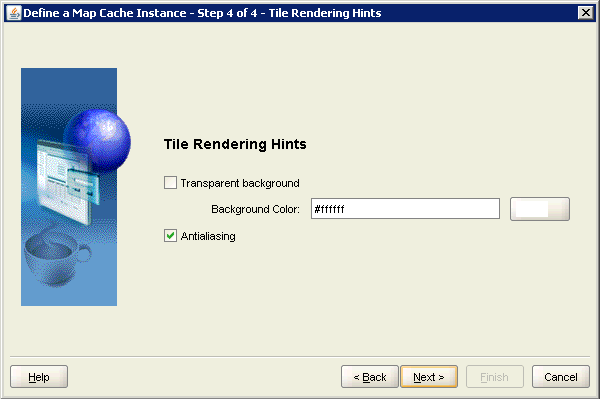
Leave the default properties as they are and click Next to open the Summary page.
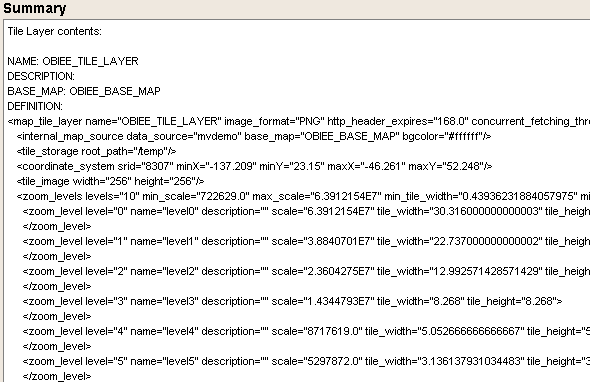
Click Finish to open the Tile Layer Definition page.
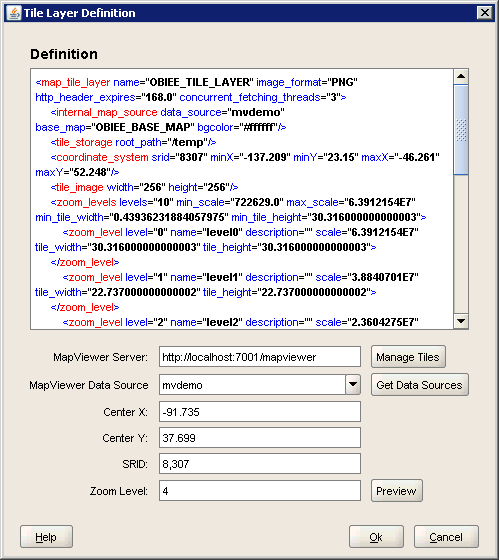
Click OK to close the Tile Layer Definition page. The OBIEE_TILE_LAYER object is added to the navigator.
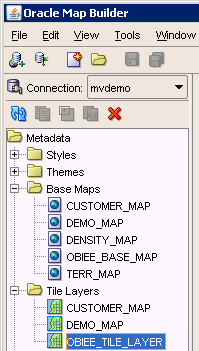
Integrating a Map with OBIEE
In this set of steps you integrate the map you created in Map Builder with Oracle Business Intelligence, so that you can display a map visualization within an OBI analysis. Before beginning this topic make sure you have uploaded the OBIEEMAP repository as described in the Prerequisites section.
Return to Map Viewer, which should still be open. If Map Viewer is not open, open a browser and enter the following URL to connect to Map Viewer: http://host:port/mapviewer. For example, enter http://localhost:7001/mapviewer. Click the Admin link and sign in.

Click Manage Map Tile Layers > Manage.
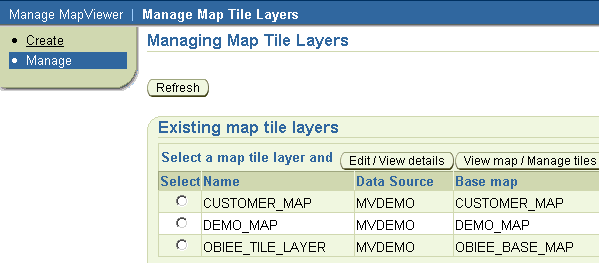
Select OBIEE_TILE_LAYER and click Bring online to expose this map to the Map Viewer application and make the map available for consumption through Oracle BI.

You should receive the following message:
Map tile layer brought online successfully [MVDEMO,OBIEE_TILE_LAYER].

Sign in to Oracle BI Presentation Services as an administrative user.
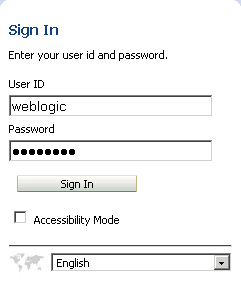
Click the Administration link.

On the Administration page, click Manage Map Data.

On the Manage Map Data page select the Layers tab.

Click the Import Layers icon to open the Import Layers dialog.

Use CRTL + Click to select the THEME_CITIES and THEME_STATES themes you created in Map Builder. Select OBIEE_TILE_LAYER in the Preview Map drop down list.
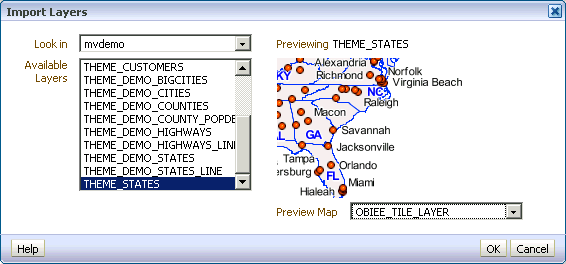
Click OK to import the layers.

Select the THEME_STATES layer and click the Edit Layers button to open the Edit Layer dialog.

In the Edit Layer dialog, under BI Associations, notice that the layer key is set to STATE_ABRV, which is the column attribute you set earlier when you created the theme in Map Builder. Click the BI Key Columns icon (green plus sign).
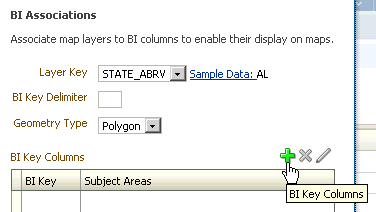
Select the OBIEEMAP subject area.

In the Select BI Key Columns dialog, expand Geo and select State as the corresponding key column from the BI repository.
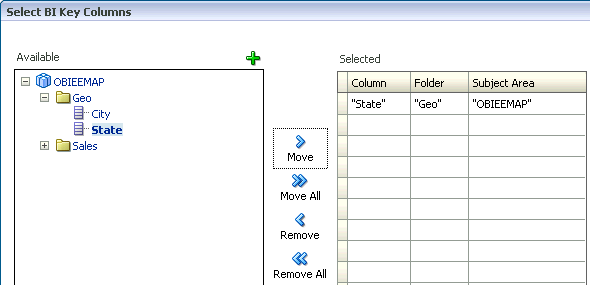
Click OK to close the Select BI Key Columns dialog. Confirm that Sample Data is visible for the STATE_ABRV Layer Key. There need not be any direct relation between the column used in the spatial schema and the column mapped in Oracle BI. You just need to ensure that the attributes match. In this case, the State column comes from the OBIEEMAP schema and the STATE_ABRV column (layer key) comes from STATES table in the mvdemo schema.
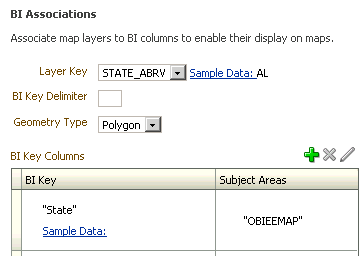
Confirm that Geometry Type is set to Polygon.

Click Sample Data for "State" and confirm that sample data is returned.
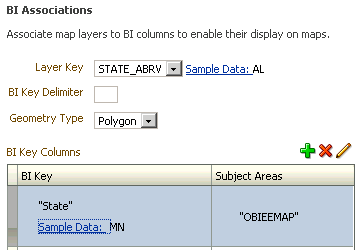
Click OK to close the Edit Layer dialog.
Select the THEME_CITIES layer and click the Edit Layers button to open the Edit Layer dialog. Notice that the layer key is set to CITY, which is the column attribute you set earlier when you created the theme in Map Builder. Confirm that Sample Data is visible for the Layer Key.
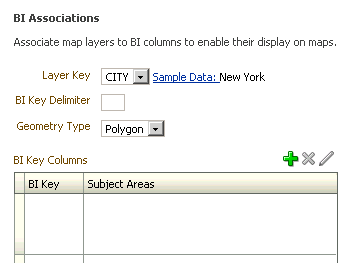
Set Geometry Type to Point.
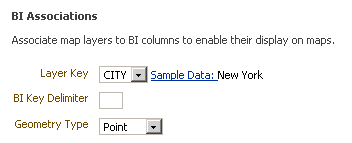
Click the BI Key Columns icon and select the OBIEEMAP subject area.

Expand Geo and move City to the Selected pane.
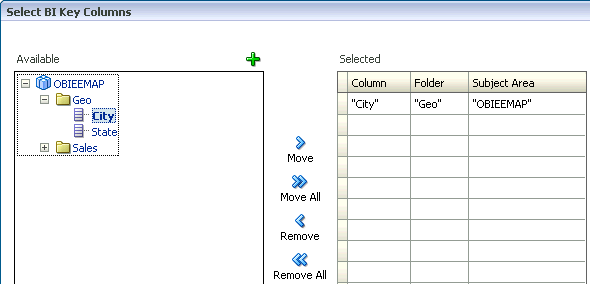
Click OK to close the Select BI Key Columns dialog.
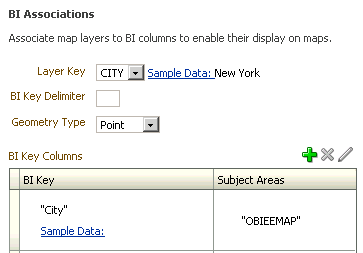
Click Sample Data for "City " and confirm that sample data is returned.
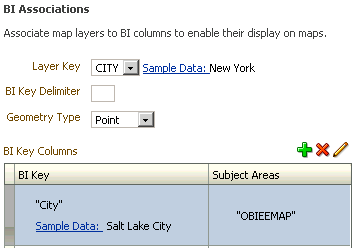
Click OK to close the Edit Layer dialog.

Click the Background Maps tab.

Click Import Background Maps to open the Import Background Maps dialog.

Select OBIEE_TILE_LAYER in the Import Background Maps dialog.
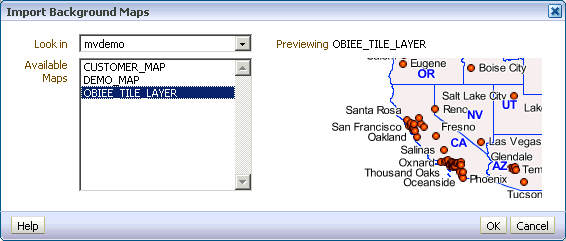
Click OK to import the OBIEE_TILE_LAYER background map.

Select OBIEE_TILE_LAYER and click the Edit Background Map icon.

In the Edit Background Map dialog, arrange the layers from top to bottom: THEME_CITIES, THEME_STATES, and select the zoom levels at which each layer can be displayed. Your results should look similar to the screenshot.

Click OK to close the Edit Background Map dialog. Confirm that the expected subject area is associated with the background map. In this example the OBIEEMAP subject area is associated with the OBIEE_TILE_LAYER background map.

Creating an Oracle BI Analysis with a Map View
In this set of steps you create an Oracle BI analysis with a map view.
Select New > Analysis and select the OBIEEMAP subject area.
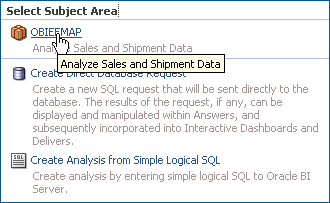
Create the following analysis:
Geo > State
Sales > Dollars

Click Results.
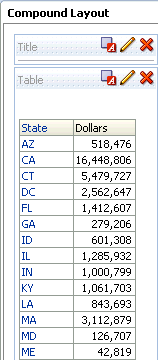
Select New View > Map.
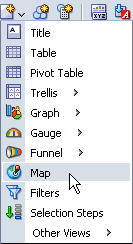
Confirm that a Map view is added to the compound layout.
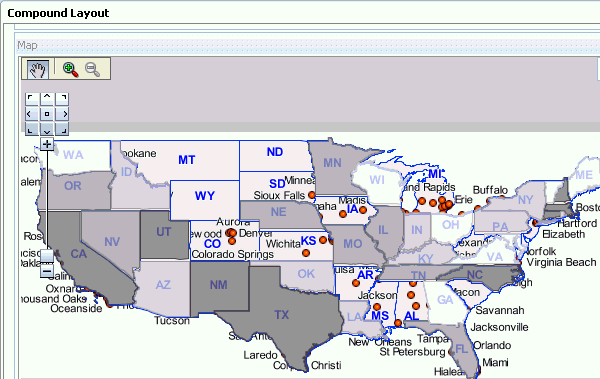
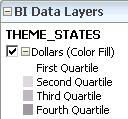
Confirm that the expected theme, THEME_STATES, is visible in the BI Data Layer. Notice that by default the Dollars data is divided into four quartiles, which are distinguished as shades of gray for use in the map.
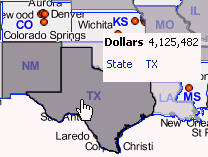
Hover the mouse over different states to view a data pop up. The screenshot shows data for Texas.
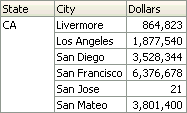
Return to the Table view and drill down on CA (California) to view City data.
Return to the Map view and notice that BI Data Layers now includes THEME_CITIES and the Map view has changed to display City data.
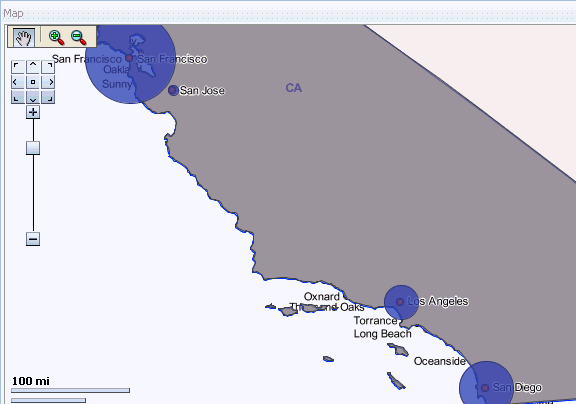
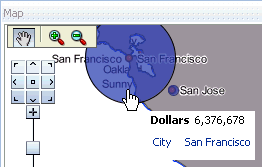
Hover the mouse over different cities to view a data pop up. The screenshot shows data for San Francisco.
Save your analysis.
Use the OBIEEMAP subject area to create the following new analysis with two measures:
Geo > State
Sales > Dollars
Sales > Units Ordered

Click Results to display a Table view in a Compound Layout.
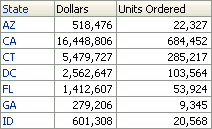
Select New View > Map View to display a Map view in the Compound Layout.

Click the Edit View icon for the Map view to open the Map editor.
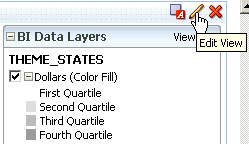
Click the Edit icon for the Dollars measure to open the Color Fill dialog.

In the Color Fill dialog select the Style drop down to change the style color.
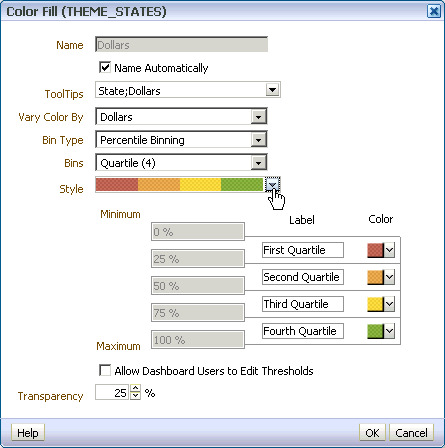
Click OK to close the Color Fill dialog and observe the changes to the map and the legend.
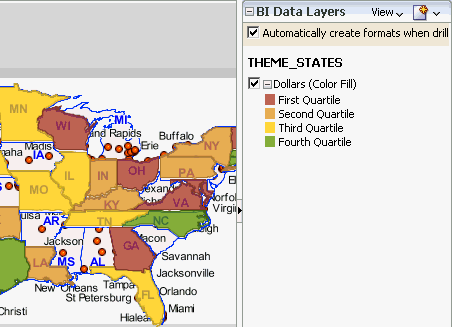
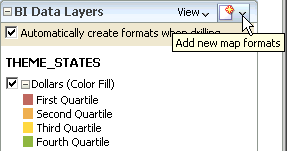
Click the Add new map formats icon to open the formats drop down list.
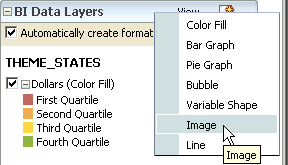
Select Image from the list.
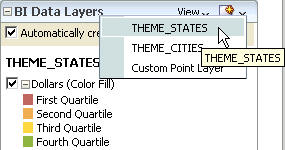
Select THEME_STATES to open the Image dialog.
In the Image dialog change Vary Image By to Units Ordered.
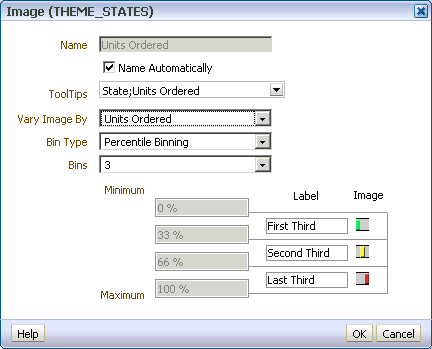
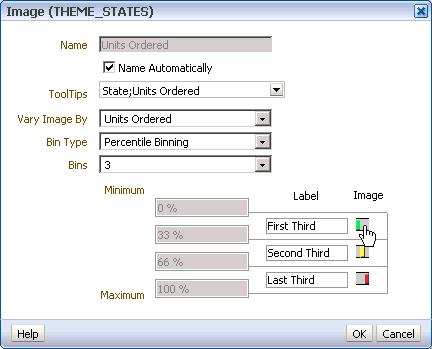
Click the image for the First Third label to open the Select Image dialog.
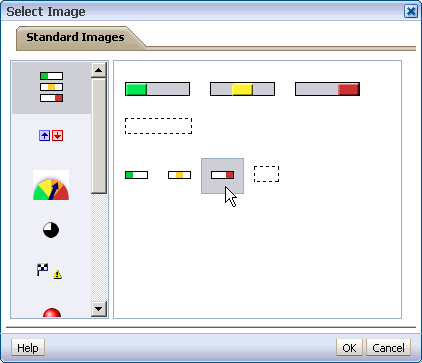
In the Select Image dialog, select the small red bar image.
Click OK to return to the Image dialog. Repeat the steps to select the small yellow bar for the Second Third label and the small green bar for the Last Third label.
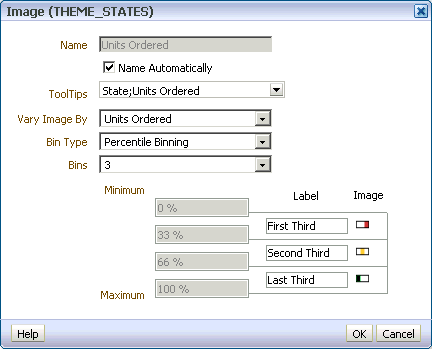
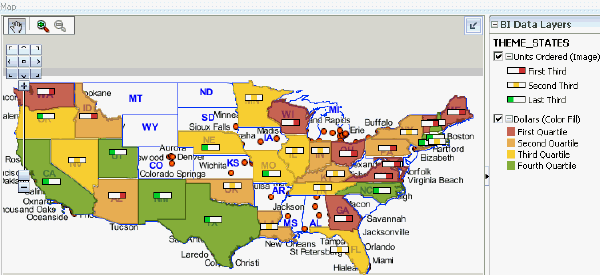
Click OK to close the Image dialog. The Map View and legend now render two measures.
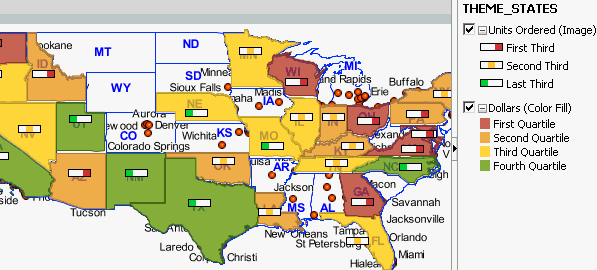
Click Done to return to the Compound Layout and verify your work in the Map view.
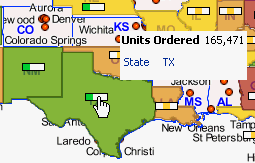
Hover the mouse over a new bar image and confirm that you see data for the Units Ordered measure. The screenshot shows the results for Texas.
Navigate to the Table view and click CA (California) to drill down to the city level.
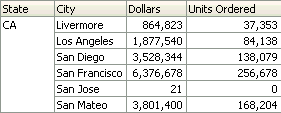
Return to the Map view and observe that both measures are rendered at the city level.
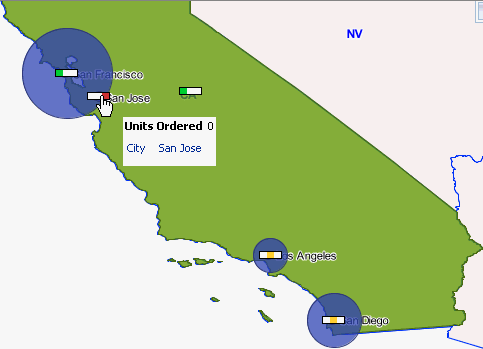
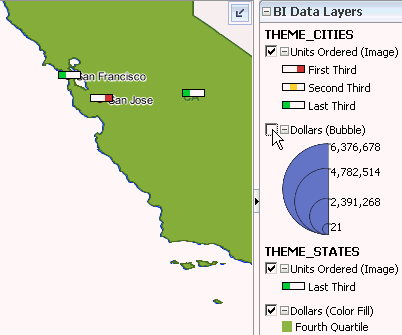
Uncheck Dollars (Bubble) under THEME_CITIES to view only the Units Ordered measure on the map.
Save your analysis.
Summary
- Use Oracle Map Builder to build maps
- Use Oracle Map Viewer to bring maps online for integration with Oracle Business Intelligence
- Embed a map into a Map view in an Oracle Business Intelligence analysis
- The mvdemo database schema, Map Viewer installer, and Map Builder installer used for this OBE, as well as additional information about these products, can be found on the Oracle Fusion Middleware Map Viewer web site.
- Oracle by Example - Business Intelligence Enterprise Edition
- Oracle Business Intelligence Documentation
- Oracle Technical Network (OTN) - Oracle Business Intelligence
- Oracle University
- Oracle Learning Library
- Lead Curriculum Developer: Jim Sarokin
This tutorial showed you how to use Oracle Map Builder and Oracle Map Viewer to build and embed maps for use in Oracle Business Intelligence analyses and dashboards.
In this tutorial, you have learned how to:
Resources
Please refer to the following resources for more information about the topics covered in this OBE:
Credits
To help navigate this Oracle by Example, note the following:
- Hiding Header Buttons:
- Click the Title to hide the buttons in the header. To show the buttons again, simply click the Title again.
- Topic List Button:
- A list of all the topics. Click one of the topics to navigate to that section.
- Expand/Collapse All Topics:
- To show/hide all the detail for all the sections. By default, all topics are collapsed
- Show/Hide All Images:
- To show/hide all the screenshots. By default, all images are displayed.
- Print:
- To print the content. The content currently displayed or hidden will be printed.
To navigate to a particular section in this tutorial, select the topic from the list.