Java SE 7: Reviewing JVM Performance Command Line Tools
Overview
- Windows XP or Windows 7 32 bit or 64 bit
- Java 7 Update 4 or later
- JEdit 4.5.1 or later
- NetBeans 7.1.2 later
- GlassFish 3.1.2 or later (Included with NetBeans)
- Java DB 10.8.1.2 or later (Included with NetBeans)
- Install JDK 7 update 4
- Install JEdit
- Install NetBeans for Java EE 7.1.2 which includes Glassfish and Java DB.
- Make sure the JDK 7
bindirectory is included in the PATH for the system. - Click Start > Computer to open the Windows that displays information about this computer.
- From the menu choose System Properties
- From the menu on the left choose Advanced System Settings
- From the Advanced tab, choose Environment Variables
- From system variables, choose the Path variable.
- Add the following to the path:
C:\Program Files\Java\jdk1.7.0_04\bin; - Start JEdit
- Start NetBeans
- From the NetBeans Services tab start GlassFish. This will start GlassFish and JavaDB.
Purpose
Java includes a number of tools you can use to monitor your Java Virtual Machine (JVM). This tutorial covers some of the command line tools available to you in JDK 7.
Time to Complete
Approximately 45 minutes
Introduction
Have you ever wanted to get information about a JVM that is already running? Find out things like what command line parameters were used to start the JVM or what was the main method used to start the JVM?
Java SE 7 includes a number of tools you can use to monitor your Java Virtual Machine (JVM). In this tutorial, learn to use the jps command and the new jcmd command to get information about currently running JVMs on a system. Then, use the process information with jstat to monitor JVM garbage collection activity locally and remotely.
Hardware and Software Requirements
The following is a list of hardware and software requirements:
Note from the Author: At the time of this writing, jcmd is not available on all platforms. The OBE was created using Windows 7 64 bit.
Prerequisites
Before starting this tutorial, you should do the following:
Using jps
- JEdit - A Java programming editor
- NetBeans - A Java IDE
- GlassFish - A Java application server
- JavaDB - A database Server included with NetBeans
What is jps?
The jps tool queries running JVMs on a system. By default, executing the command lists the JVMs running on your local system. The jps command reports the local VM identifier (lvmid) for each instrumented JVM found. The lvmid is typically, but not necessarily, the operating system's process identifier for the JVM process.
With no options, jps will list each Java application's lvmid followed by the short form of the application's class name or jar file name. The short form of the class name or JAR file name omits the class's package information or the JAR files path information. The jps command uses the java launcher to find the class name and arguments passed to the main method.
The examples that follow are taken from a Windows 7 64 bit system running the following programs:
Note: The screenshots used in the examples were not all taken from the same session. Therefore, the process IDs may change from one screenshot to the next.
To start, run the jps command with no parameters.
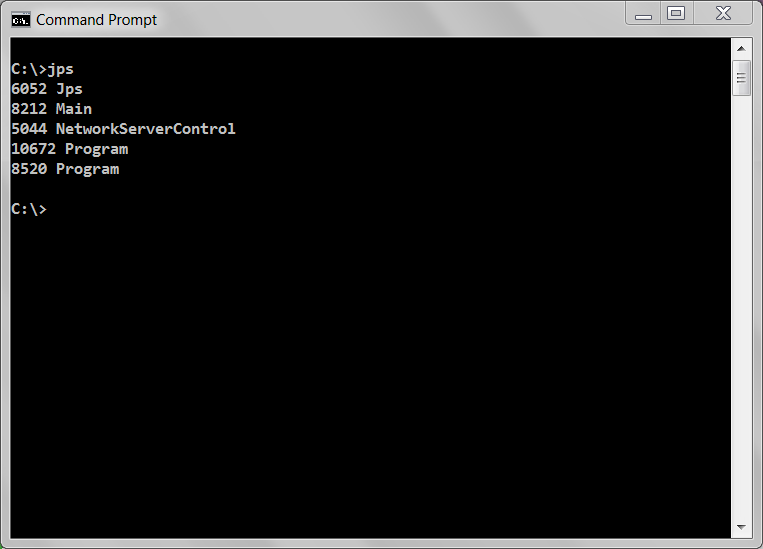
So based on the earlier discussion we should see 4 JVMs. But why are 5 shown? Because a JVM is created for the jps command. Note that the lvmid is listed along with a short name for the main method that started the JVM.
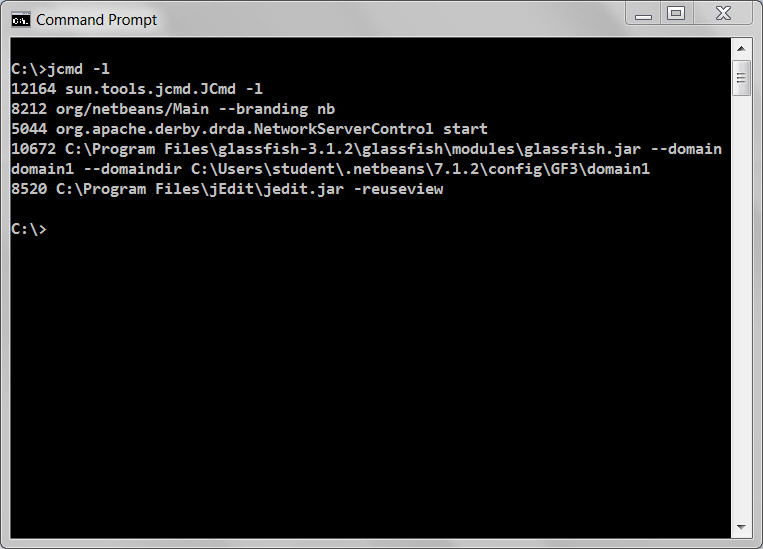
The jps -l command lists full package name along with the main method for that JVM. For a jar file, the path to the jar file is displayed instead
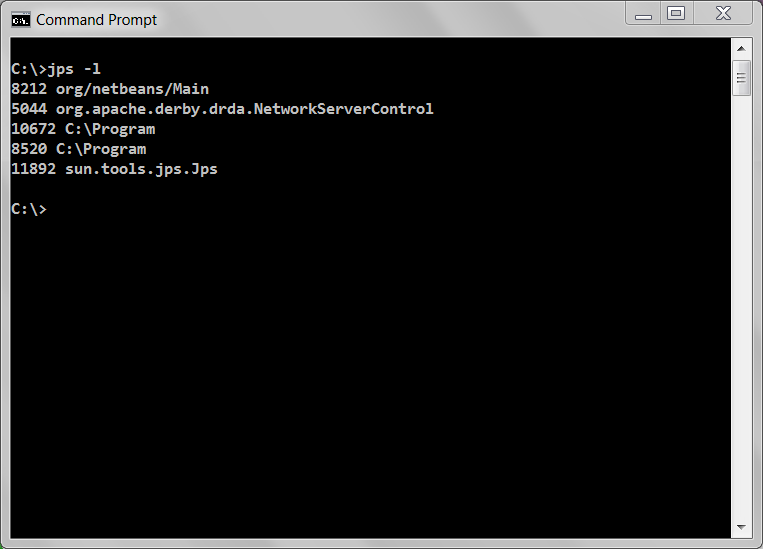
On Windows, the path name for the jar file names can be truncated. See the next option to correct this.
The jps -m command displays the same information as jps -l but adds the arguments passed to the main method.

The command fixes the truncation issue and shows the full path to the jar file.
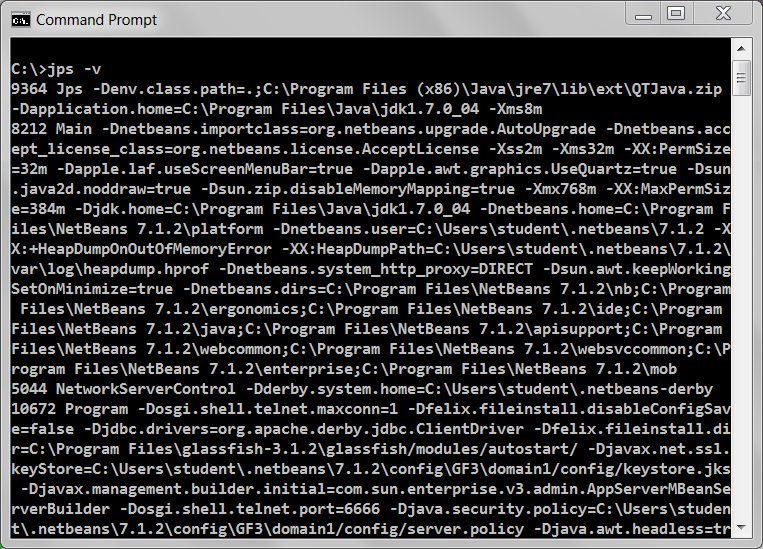
To see the arguments passed to the JVM use the jps -v option.
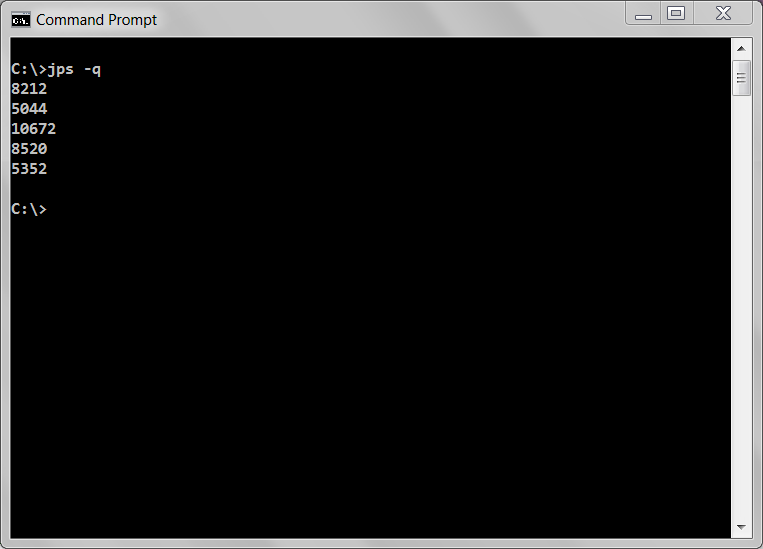
Finally, if you don't want to see all that path and class data, use the jps -q option.
That covers most of the jps options. You can use jps to remotely connect to a system. The required configuration and steps are covered later in this OBE.
Using the jcmd Command
The jcmd command is new in JDK 7 and provides many of the features of jps plus some additional information as well. The jcmd command allows you to query various aspects of specific virtual machines. Examples of some of these options are included below.
Enter the jcmd with no options.

So the default command returns results very similar to the jps -m command. The lvmid or process ID (pid), the class name or jar name, and the command line parameters are shown in the output.
Note: Since the jcmd documentation refers to the process ID as (pid) consider pid to be interchangeable with lvmid for the purposes of this OBE.
If the -l option is added, the output is the same.
So it appears jps -l is the default option.
To find out what kind of information jcmd can display about a JVM, pass the pid along with help to the command. For example:
jcmd 10672 help
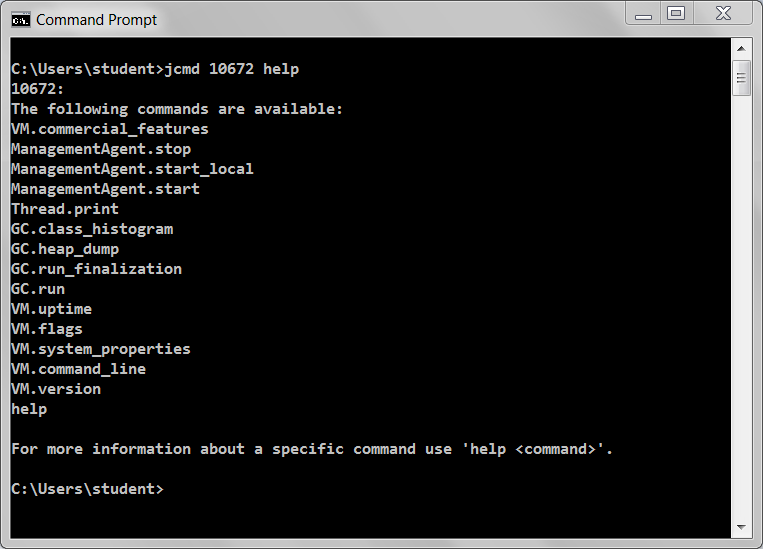
So information about the VM or the garbage collector (GC) can be queried and the results returned to the command prompt window.
To view the version of the VM for the JVM with a pid of 10672:
jcmd 10672 VM.version
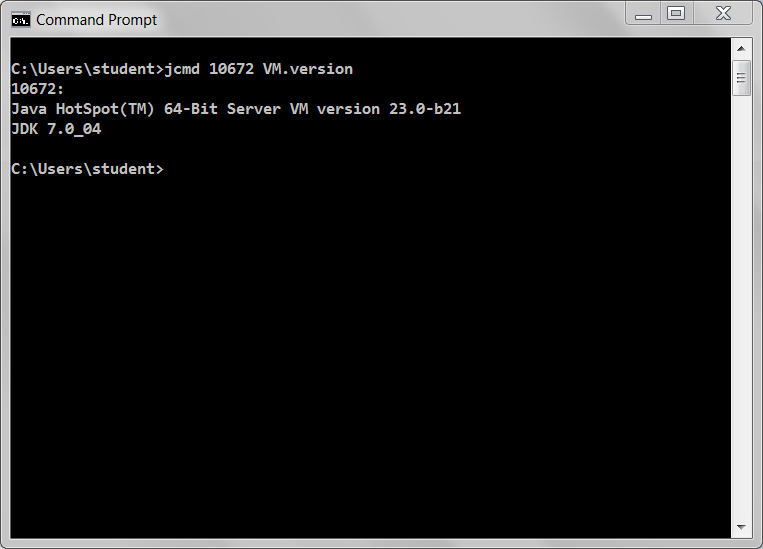
Both the Hotspot and JDK versions are displayed.
To view the system properties for pid 10672, use the following command:
jcmd 10672 VM.system_properties
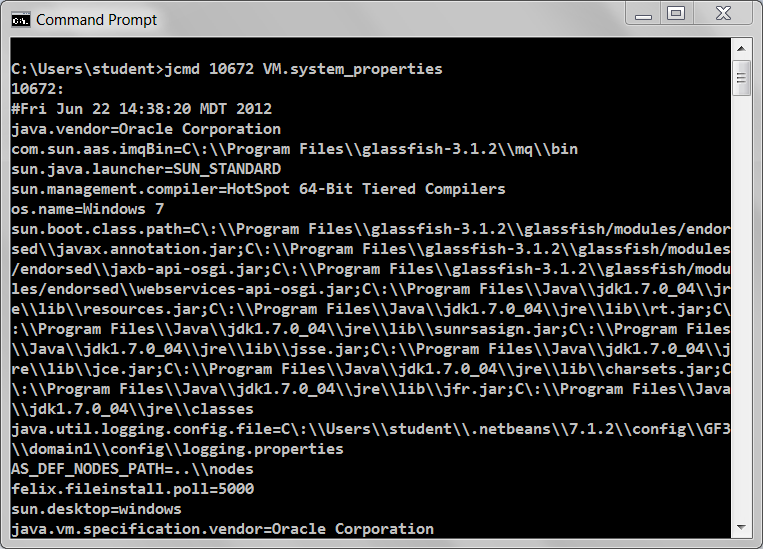
All the system properties set for this VM are displayed. As the example shows, there can be several hundred lines of information displayed.
To view the GC related flags that were applied to a JVM use the VM.flags option. For example:
jcmd 10672 VM.flags
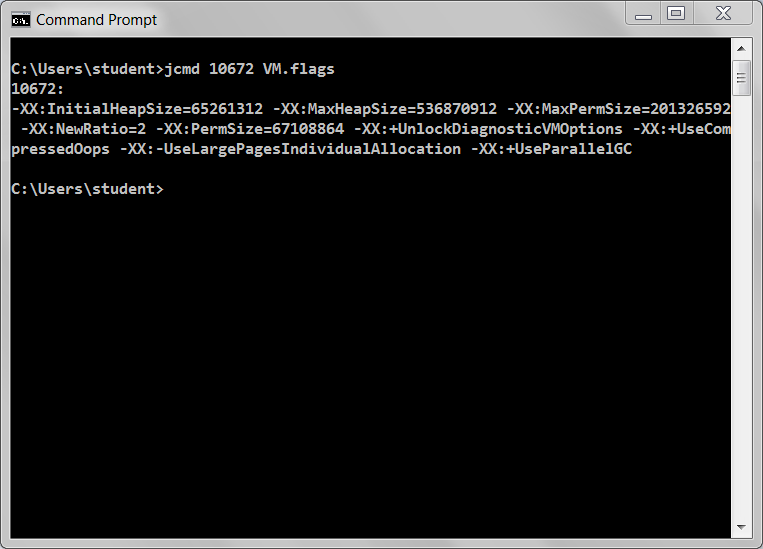
All the flags used for your VM are shown.
To view the VM's uptime use the following command:
jcmd 10672 VM.uptime
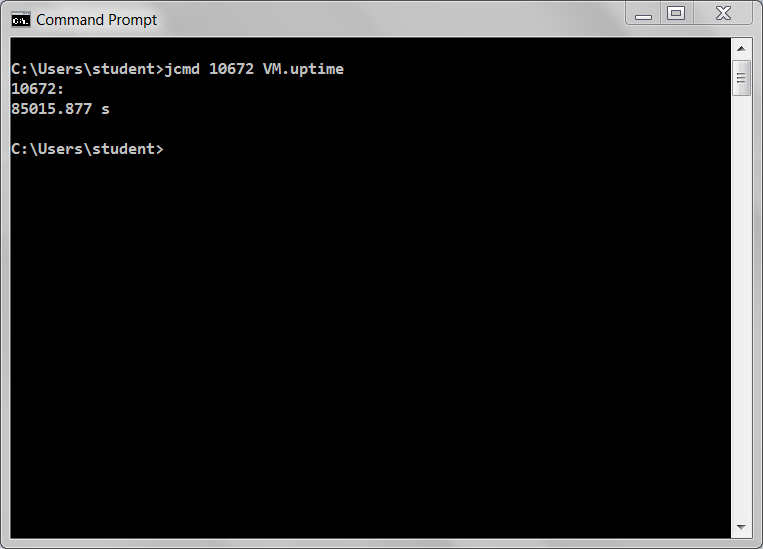
The uptime is shown in seconds. In this example, the VM has been up for 23 hrs.
An example of GC information that can be displayed with jcmd is the class histogram. The histogram shows which classes are taking up the most memory in the VM. For example, a sample command line might look like this:
jcmd 10672 GC.class_histogram > temp.txt
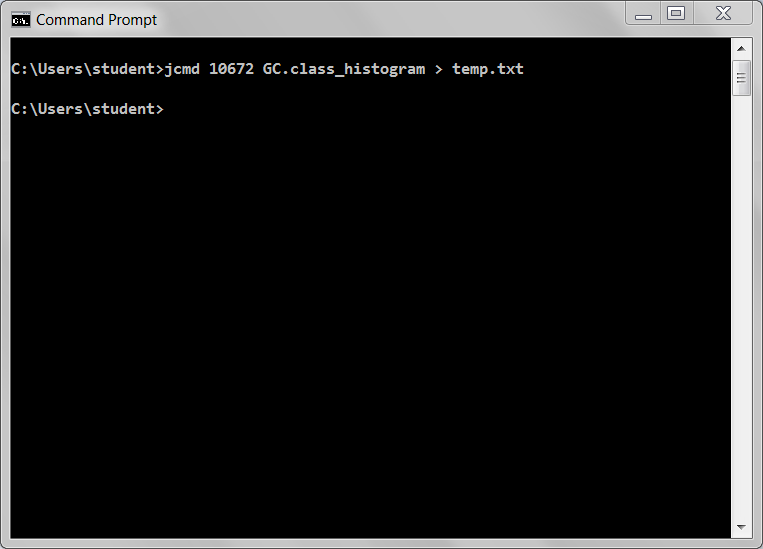
The results can be rather verbose, so you can redirect the output to a file. Both internal and application specific classes are included in the list. Classes taking the most memory are listed at the top, and classes are listed in a descending order.
10672: num #instances #bytes class name ---------------------------------------------- 1: 54231 7425056 [C 2: 43483 62663443: 43483 5924120 4: 4151 4633416 5: 100011 3200352 java.lang.String 6: 4151 3018096 7: 3436 2575680 8: 51021 1632672 java.util.HashMap$Entry 9: 23238 1607400 [Ljava.util.HashMap$Entry; 10: 7913 1412552 [B 11: 17554 966592 [Ljava.lang.Object; 12: 20134 966432 java.util.HashMap 13: 1157 626064 14: 15258 610320 java.util.TreeMap$Entry 15: 18788 601216 java.util.Collections$UnmodifiableMap 16: 4405 533376 java.lang.Class 17: 13295 531800 java.util.LinkedHashMap$Entry 18: 5628 428896 [I 19: 16207 388968 java.util.ArrayList 20: 6121 387432 [S ...
Finally, there is an option to view all the performance related counters on a VM. This example uses the PerfCounters.print option to display all the PerfCounters for a JVM Running GlassFish:
jcmd 7140 PerfCounter.print
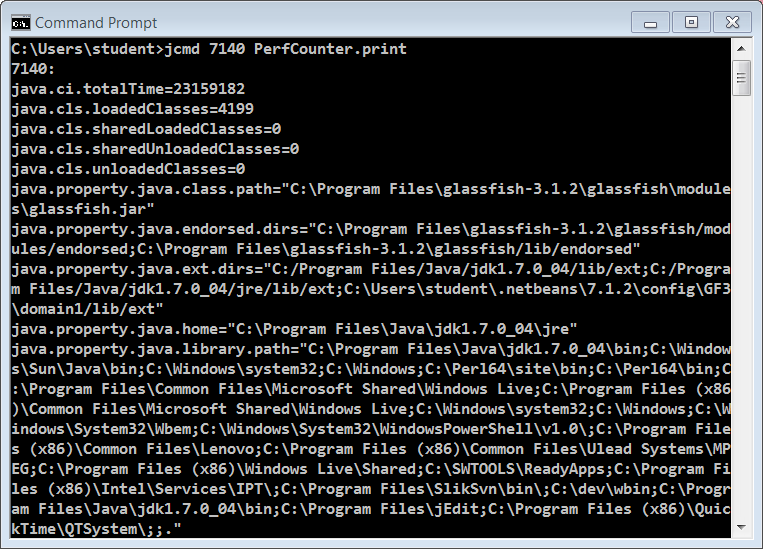
Once again the output can be quite verbose so generally you should filter the results.
On Windows, you can use the find command to filter results. For example:
jcmd 7140 PerfCounter.print | find "java.property.java.vm"
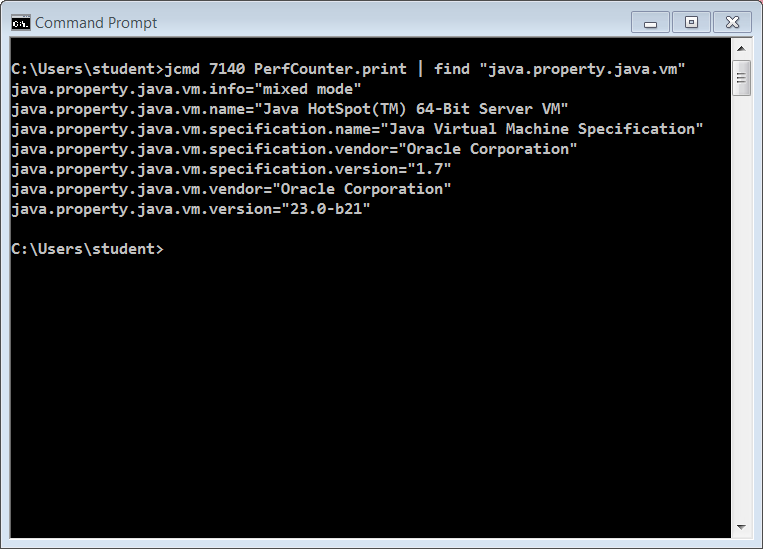
Using the find filter, only counters in the java.property.java.vm namespace are shown.
Using the jstat Utility
There are other command-line tools that can use the pid information generated from jps and jcmd. The jstat command-line tool displays detailed performance statistics for a local or remote HotSpot VM. The –gctuil option is used most frequently to display garbage collection information.
Note: When using the Concurrent Mark Sweep (CMS) collector (also known as concurrent collector), jstat reports two full GC events per CMS cycle, which is obviously misleading. However, young generation stats are accurate with the CMS collector.
Before we can use jstat, we need to get the list of JVM pids on the system. For example:
jcmd

We can use the GlassFish server with the pid of 7140 for jstat monitoring.
With a pid, the jstat command with the -gcutil option can be used to monitor the garbage collector. For example, to display gc information every five seconds use:
jstat -gcutil 7140 5000
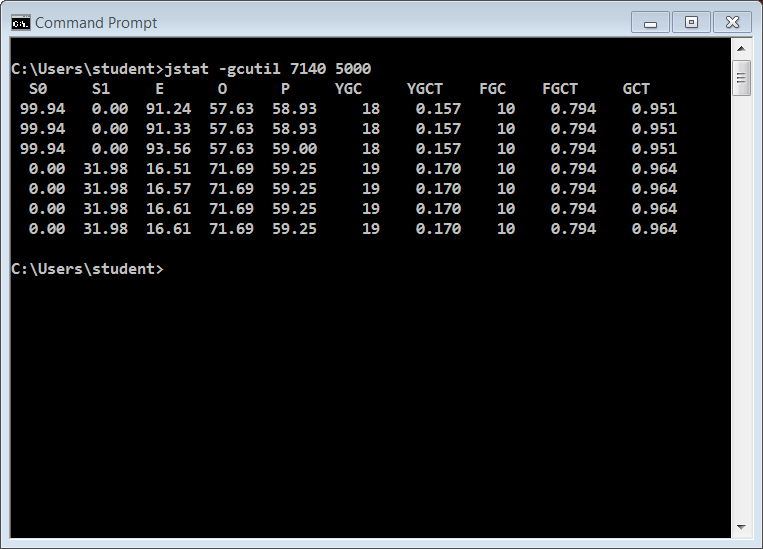
From the output, you can see between the third and fourth sample a minor garbage collection takes place. Here is an explanation of columns shown in the output:
S0: Survivor space 0 utilization as a percentage of the space's current capacity
S1: Survivor space 1 utilization as a percentage of the space's current capacity
E: Eden space utilization as a percentage of the space's current capacity
O: Old space utilization as a percentage of the space's current capacity
P: Permanent space utilization as a percentage of the space's current capacity
YGC: Number of young generation GC events
YGCT: Young generation garbage collection time
FGC: Number of full GC events
FGCT: Full garbage collection time
GCT: Total garbage collection time
The -gcutil option is only one of many options available for jstat. For more information, check out the jstat documentation.
Using the jstat Utility Remotely
The jstat command can also run remotely using the jstatd utility. Note that jstatd should not be run in a production environment and if security is a concern, running the command locally is preferred.
The first step to use the utility is to setup a policy file in the directory you run jstatd from. Open a text editor in your home directory.
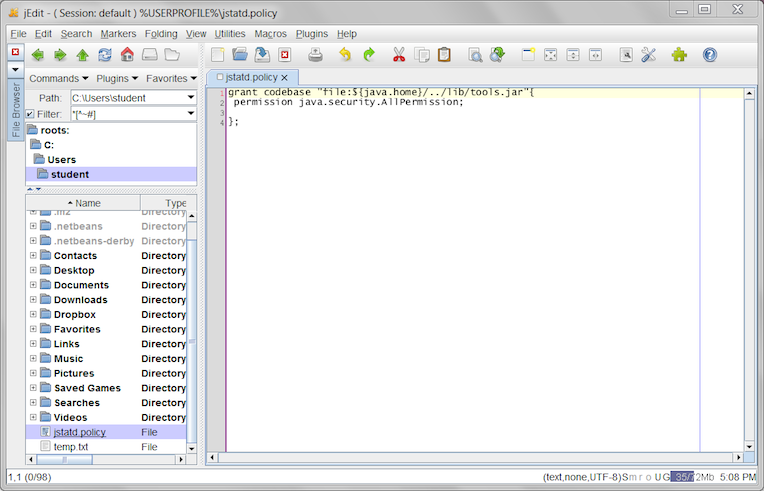
Name the file jstatd.policy. Enter the following text into the file.
grant codebase "file:${java.home}/../lib/tools.jar"{

permission java.security.AllPermission;

};
Save the file.
Note:The example policy file allows jstatd to run without any security exceptions. This policy is less liberal then granting all permissions to all codebases, but it is more liberal than a policy that grants the minimal permissions to run the jstatd server. More restrictive security can be specified in a policy to further limit access than this example provides. However, if security concerns cannot be addressed with a policy file, the safest approach is not to run jstatd and instead use the monitoring tools locally rather than connecting remotely.
Open a Command Prompt window.
To start jstatd run the utility with the following parameters.
jstatd –J-Djava.security.policy=<path to policy
       file>/jstatd.policy
If you are in your home directory and the jstatd.policy file is located there your command line would be:
jstatd –J-Djava.security.policy=jstatd.policy
The jstatd server should start. However, no information is displayed to the console.
Now connect to your machine from another machine. For example:
jstat -gcutil 2874@remotehost 5000
You should see output that is the same when the command is run locally.
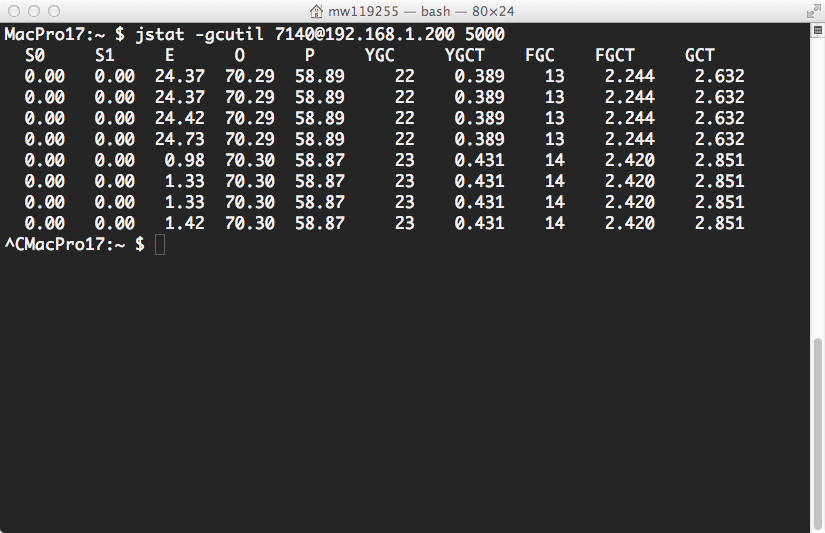
The picture shows the command run on the same VM using a remote machine running Mac OS X.
Summary
- Query a system for running JVMs using
jps - Query a system for running JVMs using
jcmd - Query various performance aspects of a JVM using
jcmd - Perform command line performance monitoring locally and remotely using the
jstatutility. - jps Documentation
- jcmd Documentation
- jstat Documentation
- Java Performance Tuning and Optimization Course
- Curriculum Developer: Michael Williams
In this tutorial, you have learned how to:
Resources
For additional information please visit the following links:
Credits
To help navigate this Oracle by Example, note the following:
- Hiding Header Buttons:
- Click the Title to hide the buttons in the header. To show the buttons again, simply click the Title again.
- Topic List Button:
- A list of all the topics. Click one of the topics to navigate to that section.
- Expand/Collapse All Topics:
- To show/hide all the detail for all the sections. By default, all topics are collapsed
- Show/Hide All Images:
- To show/hide all the screenshots. By default, all images are displayed.
- Print:
- To print the content. The content currently displayed or hidden will be printed.
To navigate to a particular section in this tutorial, select the topic from the list.