

Oracle Application Express
Interactive Reporting
The Interactive Reporting Region is an innovative new technology that allows end users to customize reports. By putting more power in the hands of users it reduces development time and effort while simultaneously enhancing application functionality. This interactive reporting region allows users to customize the layout of the data by choosing the columns they are interested in, applying filters, highlighting, and sorting. They can also define breaks, aggregations, different charts, and their own computations. Users can create multiple variations of the report and save them as named reports, output to comma-delimited files, and print them to PDF documents. To create an Interactive Report, a developer need only to define a SQL statement. Something as simple as 'SELECT * FROM EMP' become powerful with all the built in functionality of Interactive Reports. Additional resources:
Column Sorting and Filtering
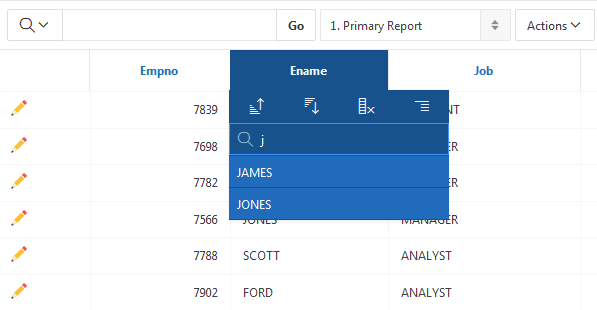
Many actions can be performed just by clicking on a column heading. This allows for sorting, hiding the column, creating a control break, viewing of help text for the column and the ability to select a value to create a quick filter.

Column Heading Menu
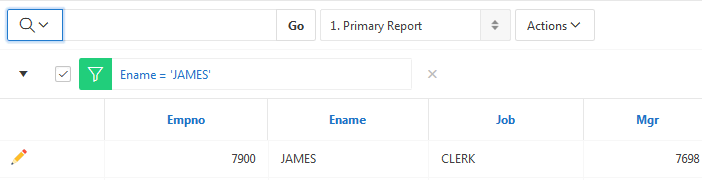
Report with Column Filter Applied
Single Row View
To view the details of a single row at a time, click the single row view icon on the row you wish to view. If available, the single row view will always be the first column. Depending on the customization of the Interactive Report, the single row view may be the standard view or a custom page that may allow update.
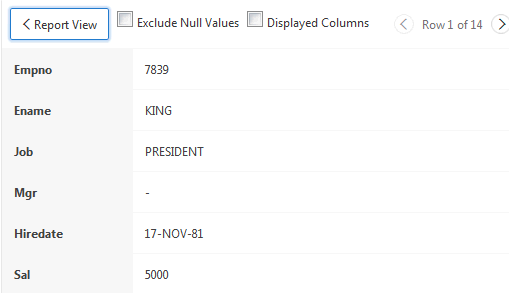
Single Row View
Search Bar
Allows for quick searching of the data, changing the number of rows displayed, and invokes the Actions Menu. Searches here will go against all text data.
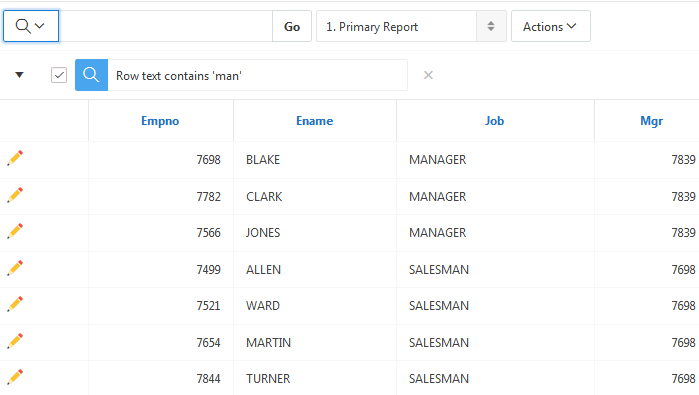
Row Search
Actions Menu
The Actions Menu contains many tasks that are useful in manipulating your Interactive Report.
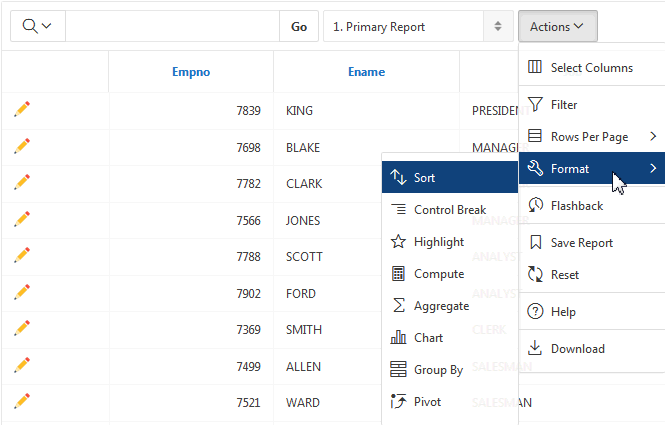
Actions Menu
Select Columns
Select Columns is used to modify the columns displayed. The columns on the right are displayed. The columns on the left are hidden. You can reorder the displayed columns using the arrows on the far right. Computed columns are prefixed with **.
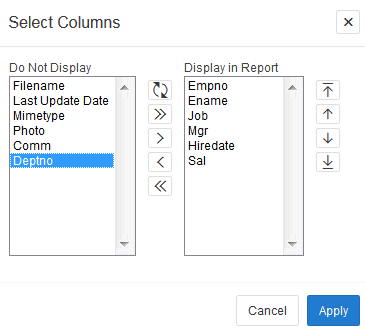
Selecting Columns to Display
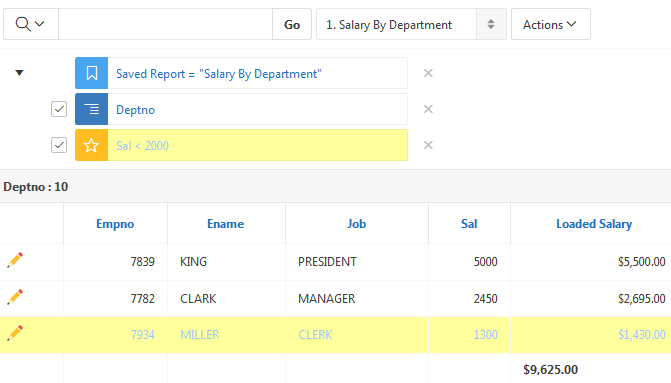
Control Break, Highlight, Compute, Aggregate
Control Break is used to create a break group on one or several columns. This pulls the columns out of the Interactive Report and displays them as a master record. Highlighting allows you to define a filter. The rows that meet the filter are highlighted using the characteristics associated with the filter. You can highlight the entire row or just the affected cell and can select a new color both for the background and the text. Computations allow you to add computed columns to your report. These can be mathematical computations (e.g. NBR_HOURS/24) or standard Oracle functions applied to existing columns (some have been displayed for example, others, like TO_DATE, can also be used). Aggregates are mathematical computations performed against a column. Aggregates are displayed after each control break and at the end of the report within the column they are defined.
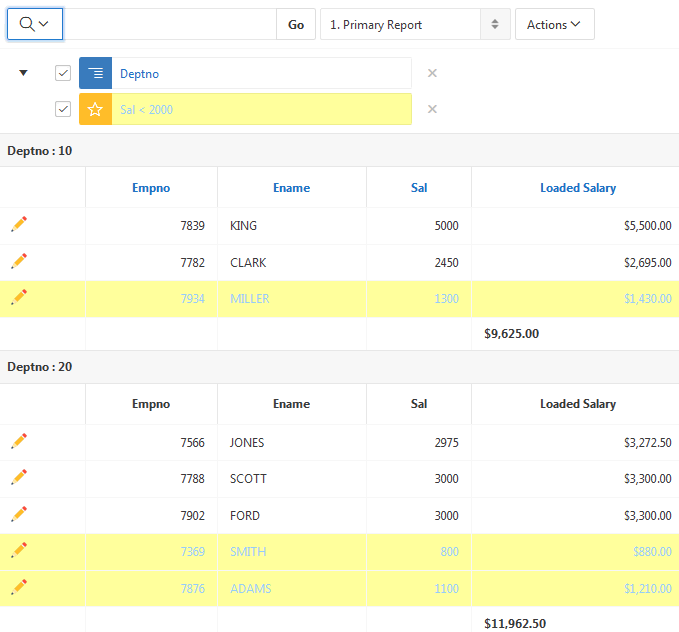
Report with Control Break, Highlight, Computed Column and Aggregate
Chart
You can include one chart per Interactive Report. Once defined, you can switch between the chart and report views using the icons in the search bar. The available chart types are horizontal bar, vertical bar, pie or line.
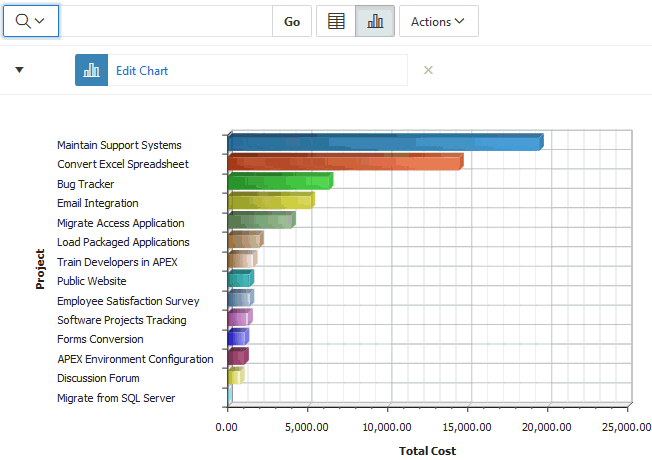
Horizontal Bar Chart
Save Report
Save Report saves the customized report for future use (it will be there after logging out and back in again). You provide a name and an optional description.
Saved Report
Flashback
Flashback performs a flashback query to allow you to view the data as it existed at a previous point in time. The default amount of time that you can flashback is 3 hours (or 180 minutes) but the actual amount will differ per database. The first image is after a data change, notice the salary for King. The second image is looking at the data as it existing 5 minutes ago.
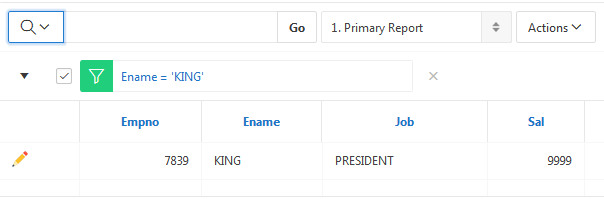
Before Flashback
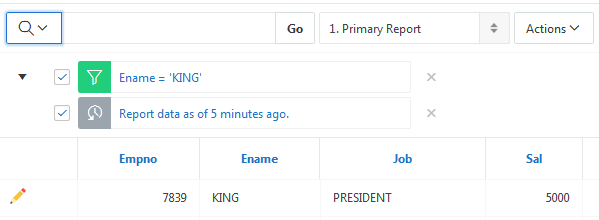
With Flashback Applied
Disabling or Removing customizations
Reset brings the report back to the default settings, removing any customizations that you have made. You can also uncheck the checkbox next to any customization to temporarily disable it or click the icon with the red x to remove the customization. The area showing your customizations can also be expanded and contracted.
Conclusion
A developer need only define a single SQL query and all the features described, unless explicitly disabled, will be available to the end users. Developers can enable and disable features to customize the reports for their specific use case. Interactive Reports is a significant step forward for Web data reporting. Database reporting has always been strength of Application Express and Interactive Reports takes Application Express to a whole new level.