KPI library
Oracle Fusion Analytics includes a library of best practice key performance indicators (KPIs) that enable teams to monitor performance against specific organizational objectives.
Get started with Fusion Analytics for free
Select your KPIs, get up and running quickly, and realize immediate business benefits. Explore our prebuilt content with your own data and start making better decisions faster.
Ready-to-use, best practice KPI library
Get a library of ready-to-use, best practice KPIs across HR, finance, supply chain, and CX to ensure teams meet the overall goals of their organization, and make quick, collaborative decisions. Here are a few common ways KPIs are analyzed to quickly find insights. Expand each analysis to see example business questions answered from different departments.
-
Compare by QoQ/YoY/MoM
- Compare a metric at one time period with those of a comparable period (YoY, QoQ, MoM). See these examples.
- Finance
What is the QoQ or YoY trend for accrual bookings due for reversal in next accounting period?
- HR
Is there an increase or decrease in employee attrition compared to the same period during the previous year?
- Supply chain
What are the total booking, returns, shipped, on-time shipped, or perfect orders compared to the previous quarter?
- CX
How does my current month pipeline compare to the same month of last year?
-
Compare to targets and benchmarks
- Compare a metric to targets, budgets or benchmarks. See these examples.
- Finance
What is the actual performance vs. the budgeted performance of the top balance sheet metrics for the last quarter or year?
- HR
Will I meet my diversity and inclusion requirements?
- Supply chain
What is the average fulfillment time compared to targets for the products sourced from different supply types?
- CX
Is the overall pipeline healthy enough to meet sales goals?
-
Slice and dice for different viewpoints
- Slice and dice a metric into different points of view. See these examples.
- Finance
What is the revenue mix by geography, business units, product lines, SKU, key customers, transaction source and transaction type?
- HR
Which jobs have a faster fill rate compared to the average time taken to fill?
- Supply chain
What is the inventory value for an item, item category, and organization?
- CX
What is the revenue lost to competition for a specific product/product group?
-
See trend over time
- See a metric trend over time with data snapshots. See these examples.
- Finance
What is the average number of days for invoices on hold and the trend for the past six quarters?
- HR
Can I get a comparison of the trend of high vs. low and high vs medium performers for the last 4 quarters?
- Supply chain
What is the trend in inventory movement in and out for items, item category, and plants?
- CX
What is the QoQ trend for the Win/Loss conversion rate?
-
Drill down to details
- Drill down from a metric summary view to transaction details. See these examples.
- Finance
Analyze GL Balances/Journals with the ability to drill down to the extended details of subledger transaction attributes and accounting
- HR
Can I get a list of top 5 teams/managers based on the percentage of workers with high performance?
- Supply chain
Identify the items, categories, and suppliers with compliance issues in their purchase agreements down to the purchase orders details
- CX
Are there any workload balancing issues in my team, with a few members performing most of the sales activities?
HR KPIs
Below is a sample list of the available prebuilt KPIs that you can get started with using your Oracle Cloud HCM data.
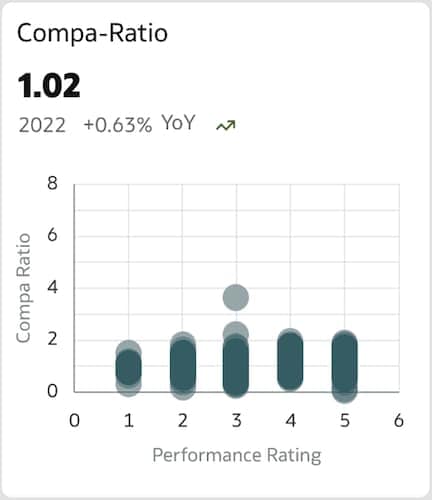
Workforce
- Headcount, full-time employees (FTE), hires
- Promotion rate
- Headcount movement
- Gain hire, transfer, promotion
- Loss termination, reorganization
- Assignment gain, hire
- Span of control
- Compa-ratio
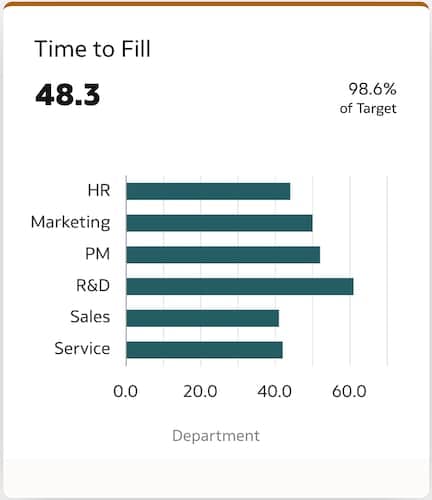
Talent management
- Hires (referral, internal, etc.)
- Talent yield
- Drop-off rate
- Offer acceptance rate
- Hires to goal
- Time to hire
- Average time to fill
- Requisition fill rate
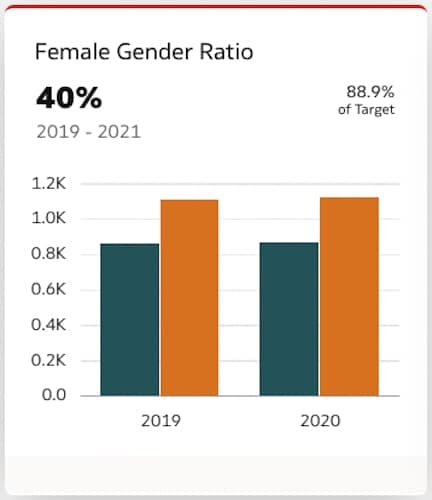
Diversity
- Diversity ratios
- Average tenure
- Manager diversity ratio
- Analysis by worker age bands
- Distinct worker nationalities
- Distinct worker ethnicities
- Percentage of workers hired above 60 years of age
- Applications and offer diversity
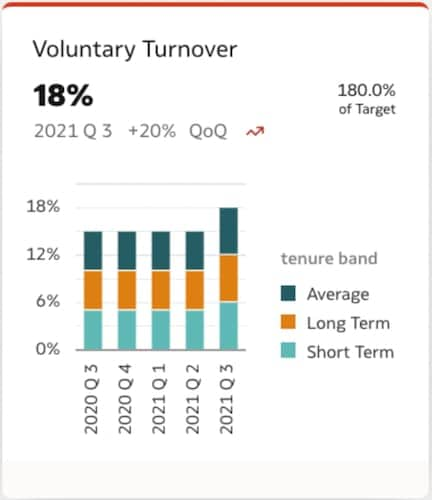
Retention and attrition
- Terminations by voluntary, new hire, top talent
- Turnover by involuntary, new hire, high performer
- Turnover by top talent compa-ratio
- Retention by FTE, new hire, top talent
Performance
- Overall worker rating
- High performers
- High potential employees
- Manager section rating
- Incomplete performance appraisals
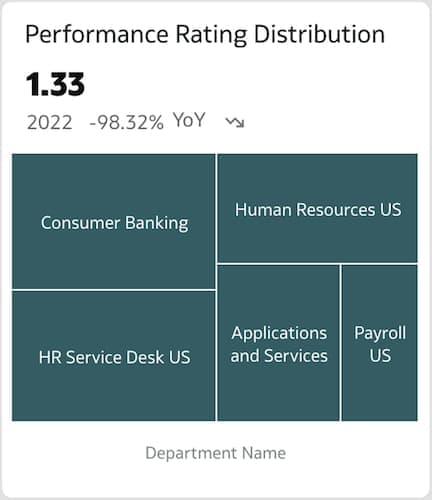
- Performance rating distribution
- Delayed performance tasks
Compensation
- Compensation amount
- Compensation variance
- Average allocation percentage
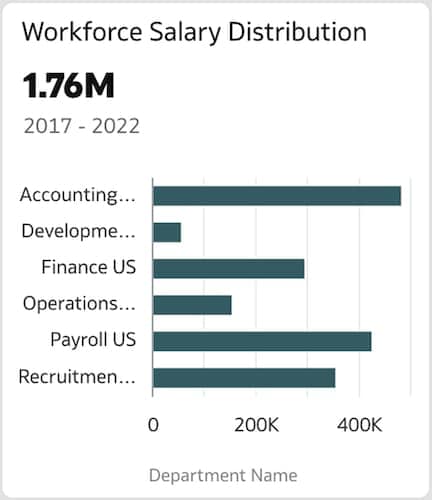
- Workforce salary distribution
- Workforce with salary amount below range
- High performer salary change percentage
- Average annualized salary
- New hire salary cost
Talent profiles and skills
- Percentage of workers with active profiles
- Profiles that require travel
- Competencies
- Percentage of workers by next career move timing
- Workers willing to relocate
- Workers ready for a career move now
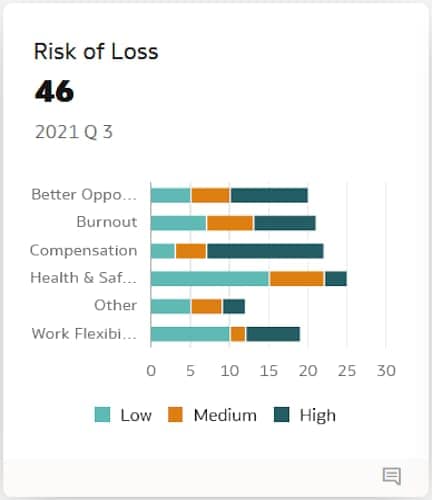
- Workers with risk of loss
- Workers with impact of loss
Finance KPIs
Below is a sample list of the available prebuilt KPIs that you can get started with using your Oracle Cloud ERP data.
General ledger
- Revenue
- Operating expense
- Net income
- EBITDA
- Payroll cost
- Net working capital
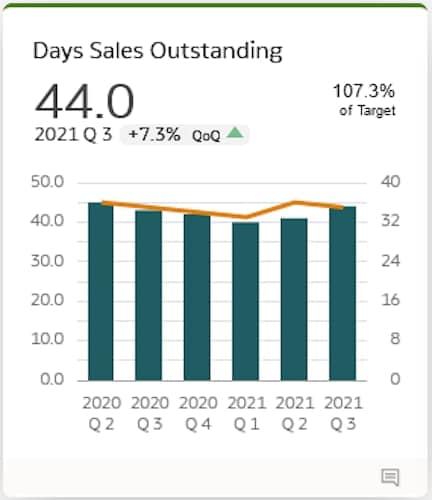
- DSO, DPO, and DIO
- Current and quick ratio
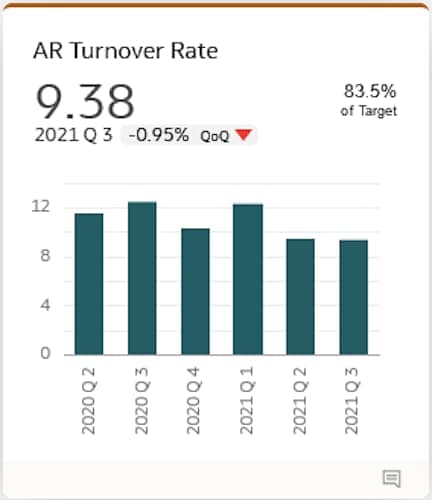
Receivables
- AR outstanding
- AR average days outstanding
- AR aging
- AR current due, overdue
- AR average invoices amount
- AR receipts
- AR debit/credit memos amounts
- AR distribution amount
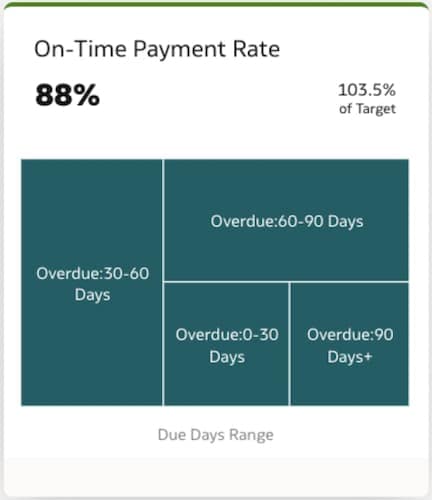
Payables
- AP current due, overdue
- AP average supplier payment days
- AP turnover
- AP aging
- AP on-time and overdue payments
- AP discount taken and lost percentage
- AP average days on hold
- AP percent interest penalties paid
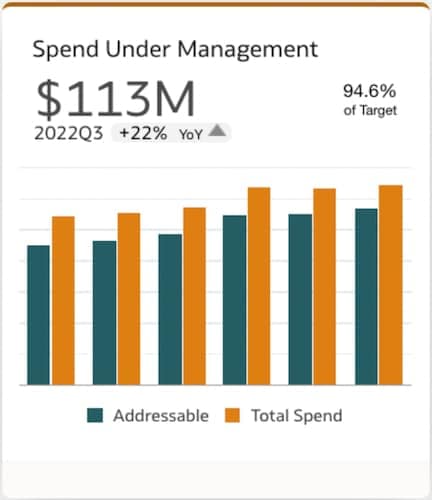
Spend
- Addressable spend
- PO matched spend
- Agreement leakage spend
- Negotiated spend percentage
- Average spend per invoice
- Top ten suppliers
- PO matched spend percentage
- Max, min, average unit price
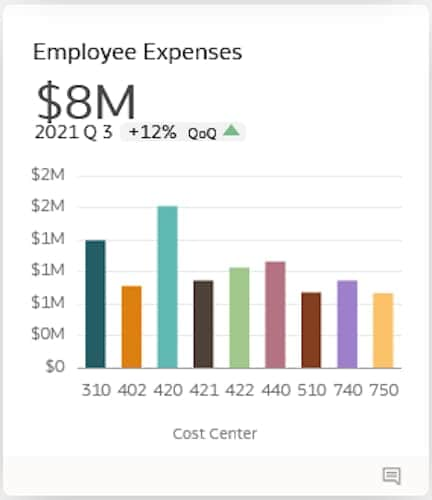
Expense
- Total and average expense amount
- Credit card expense amount
- Cash expense amount
- Manual and auto audit percentage
- Expense approval cycle time
- Expense filing cycle time
- Cash expense reimbursement cycle time
- Average days late
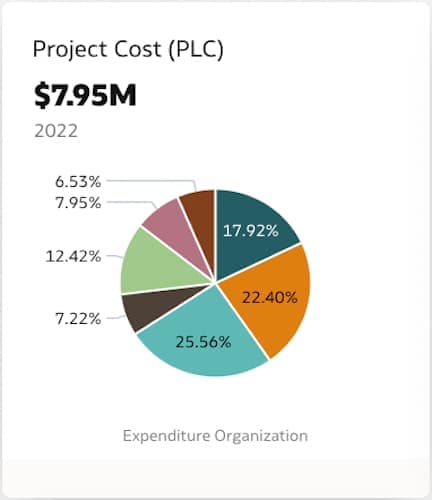
Project
- Project revenue
- Project margin
- Project cost
- Project remaining current budget cost with commitments (PLC)
- Project current forecast margin percent inception-to-date (ITD)
- Project current EAC margin (PLC)
- Project current budget margin (ITD) (PLC)
Supply chain KPIs
Below is a sample list of the available prebuilt KPIs that you can get started with using your Oracle Cloud SCM data.
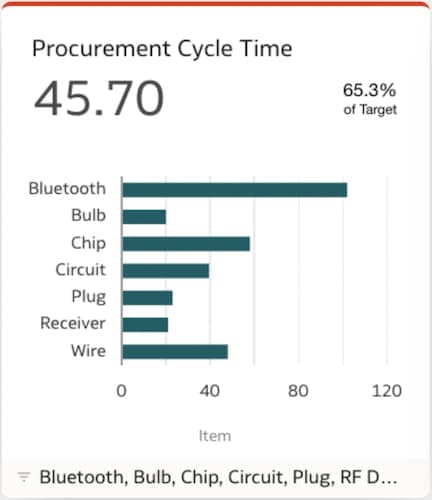
Procurement
- Agreement utilization
- Contracts expiring
- Items on agreement
- Requisition-to-receipt cycle time
- Purchasing analysis by discounts, shipped, short closed, etc.
- Receipt analysis by delivery, rejected, returns, etc.
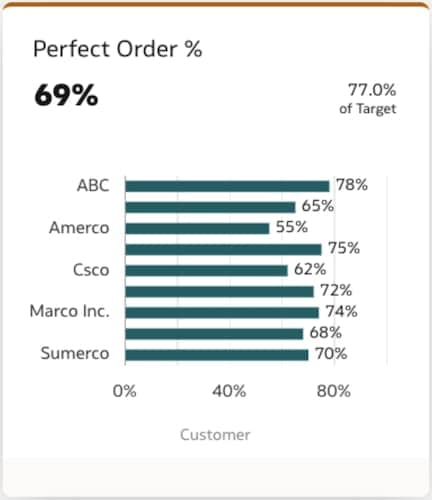
Order fulfillment
- Perfect sales order count and percentage
- Average hold time
- Sales order past due amount
- Sales order shipped in full percentage
- Sales order on-time shipment percentage
- Sales order open return amount
- Sales order-to-shipment cycle times
- Average sales order promising delay
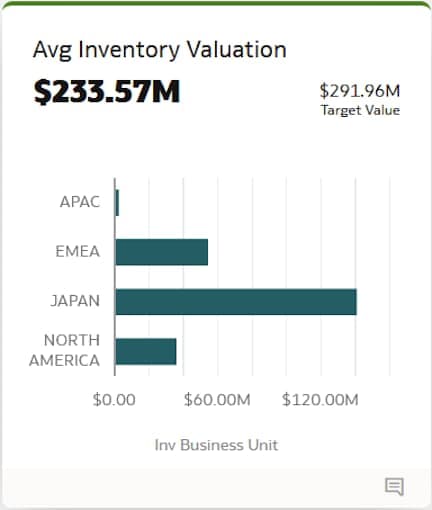
Inventory
- Inventory on-hand quantity and value
- Item unit cost
- Profit in inventory
- Percentage material cost
- Percentage material overhead cost
- Percentage resource cost
- Percentage overhead cost
- Percentage profit in inventory
CX KPIs
Below is a sample list of the available prebuilt KPIs that you can get started with using your Oracle Cloud CX data.
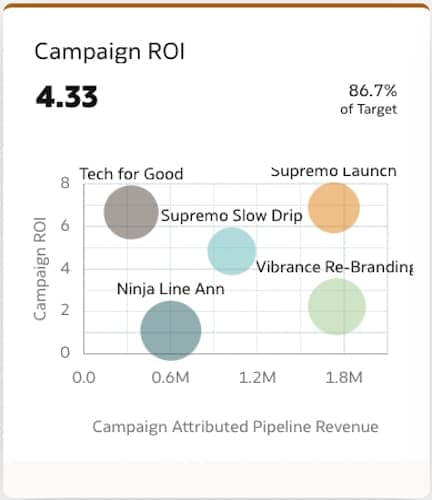
Marketing
- Campaign attributed leads
- Campaign actual vs. budgeted cost
- Cost per opportunity
- Cost per attributed revenue
- Cost per win
- Top campaigns
- Campaign ROI
- Campaign attributed pipeline
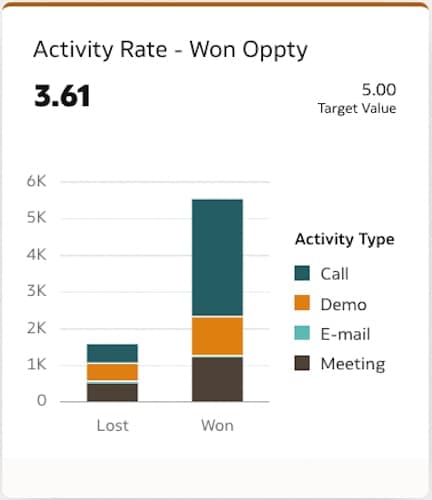
Sales
- Pipeline velocity
- Funnel leakage
- Lead-to-opportunity velocity
- Win-rate percentage
- Lead conversion rate
- Average lead age
- Activity rate per won opportunity
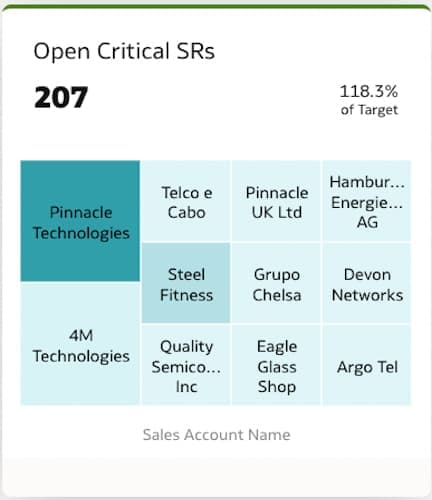
Services
- Service request overview
- Service request backlog rate
- Escalation rate
- Service request resolution rate
- Agent performance
- Requests by service category
- Requests by channel
- Customers by active request
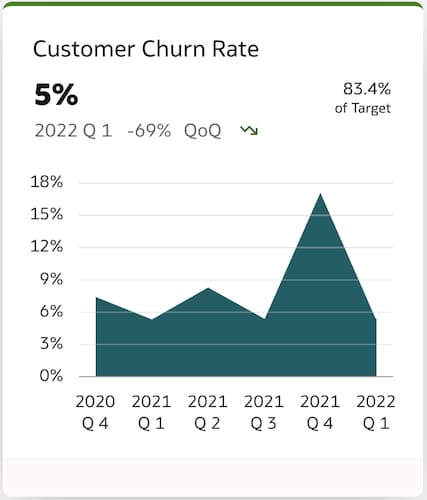
Subscription
- Monthly recurring revenue (MRR)
- Annual recurring revenue (ARR)
- Average revenue per user
- Customer lifetime value
- Customer acquisition cost
- Churn rate
- Lead velocity rate
- Subscriber return on investment
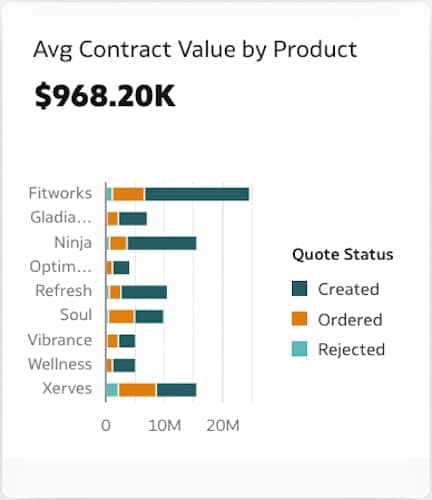
Quote
- Average quotes per won opportunity
- Active quotes
- Quote cycle time
- Quote conversion rate
- Average contract value
- Opportunity-to-quote velocity
- Average recurring revenue
- Active quote win rate
Simple, intuitive user experience
Oracle Fusion Analytics provides a consistent, intuitive user experience across any device to easily monitor business performance with KPIs as central focal points. Create personalized dashboards of KPIs based on your needs, for example, a QBR meeting or monitoring performance of a specific business unit, cost center, or product line. Pick and choose prebuilt or custom KPIs from the KPI library and customize them to fit your needs.

Drill to detail with prebuilt dashboards
Oracle Fusion Analytics also includes prebuilt dashboards to jump-start deeper analysis and exploration into specific business topics and use cases. Dashboards are easily navigated from KPIs with drill-through context all the way to transaction details.
- Attrition analysis
- Compa-ratio distribution
- Diversity analysis
- New hire trends
- Team effectiveness

- Operating expense analysis
- Profitability analysis
- AR transactions activity analysis
- AP payments analysis
- Working capital analysis
- Employee expense analysis

- Sales order fulfillment analysis
- Open sales order analysis
- Inventory transaction analysis
- Procurement spend supplier overview
- Supplier shipment analysis
- Purchase agreement analysis

- Activity rate-won opportunities
- Lead conversion rate
- Campaign attributed opportunities
- Campaign activity overview
- Sales pipeline-pipeline trend YoY
- Quote cycle time
- Critical SRs
- Subscription trends
