A Machine Learning Approach for Predicting Household Size
Selim Mimaroglu, Director of Data Science and Machine Learning
Anqi Shen, Principal Data Scientist
Household size is an important piece of information that is used for various eligibility and planning tasks: energy affordability, water affordability, grid planning, water demand and planning, energy efficiency programs including home energy reports with neighbor comparisons, and waste management planning. The building sector accounts for more than 30 percent of total world energy consumption, and the number of people in residential buildings, also known as “household size,” greatly affects total energy usage (Rueda 2021).
In recent years, there has been a lot of interest in occupancy detection via machine learning and smart thermostats. Most smart thermostats can detect occupancy accurately within their sensors' reach. There is some good modeling work, and software implementations of that work, that can predict occupancy in a household, as well. Occupancy detection is used as an integral part of energy efficiency, especially with HVAC: when there is no occupancy, HVAC heating and cooling set points are adjusted for promoting energy savings. Occupancy detection, regardless of how it is performed, has a binary outcome: occupied vs. not occupied. Although this information may be very useful in some scenarios, it falls short for conducting some of the use cases and tasks described above, especially for planning and affordability eligibility.
In this work, we share our machine learning model that can very accurately predict the number of people living in a household. Before going into the details, it is important to point out that fine-granularity household size data is not available in most regions of the United States. The U.S. Census provides only average household size per census tract. Although this information can be useful in some cases, it can't answer detailed, personal, or household-level questions, the answers to which are needed for the Low Income Home Energy Efficiency Assistance Program (LIHEAP) and Low Income Household Water Assistance Program (LIHWAP) federal eligibility programs, and most state-run programs such as the Maryland Energy Assistance Program (MEAP). Household size affects energy usage; some of the large appliances are correlated with household size, such as the water heater, washer, dryer, and dishwasher. Household size also affects water usage and waste produced. Therefore, knowing household size at a granular level can be very useful for (smart) grid planning, water demand and planning and waste management.

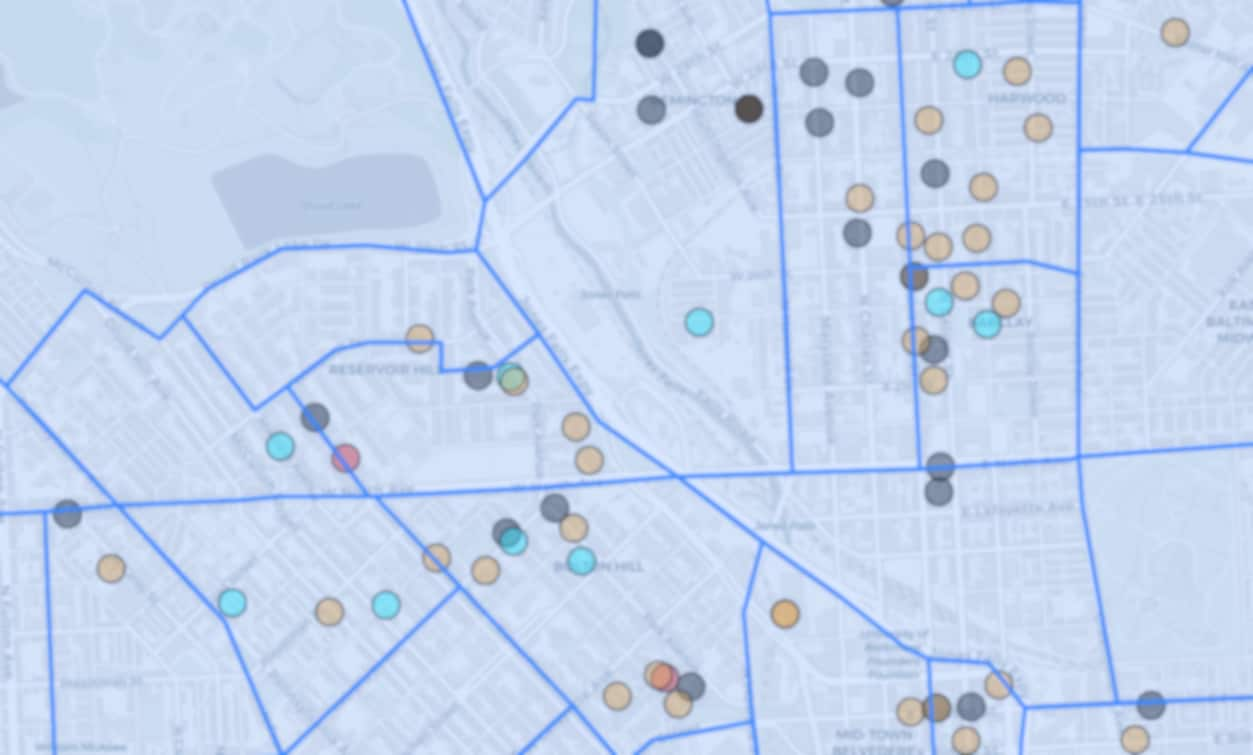
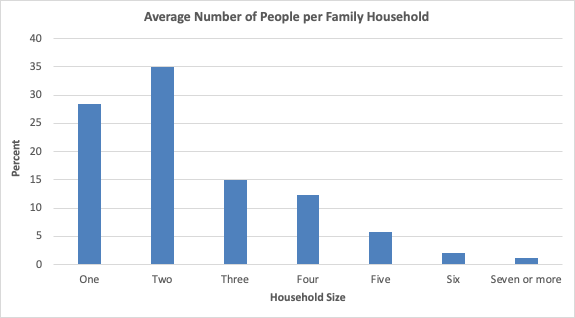
Our deep learning models are capable of predicting household size at personal level, as seen in Figure 1 above. The U.S. Census provides average family size information (Figure 2) for large regions of several hundred homes, known as tracts. The U.S. Census also provides household size distribution (see Figure 3, which depicts this information about some areas in Maryland). For most of the energy affordability, water affordability and grid planning tasks, finer granularity in household size, similar to what is provided by our model, is needed.

Machine learning methodology
We have searched the literature, but we haven’t found any comparable machine learning modeling work. Our aim is to predict household size from electricity energy data, which can be part of Advanced Metering Infrastructure (AMI) or billing data. We innovated our deep learning architecture, after carefully reviewing state-of-the-art deep learning architectures published by researchers. We tried to keep the number of the parameters and the depth of the model at reasonable levels for efficient training and scoring. Our final architecture has approximately 30 layers, and it is composed of roughly 600k parameters.
Our models are able to predict the number of active occupants in the house at weekly granularity. For larger granularities, such as months or a year, we aggregate weekly outputs into the target granularity.
Comparison
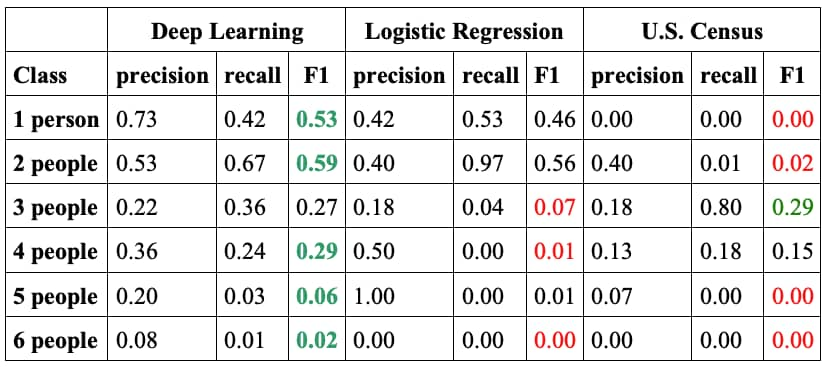
We performed head-to-head comparisons between our deep learning model, logistic regression, and U.S. Census tract on a considerably large area in Maryland. Logistic regression, which is a popular classification model, is trained on the same training data set and is evaluated on the same development set as the deep learning model. We have listed precision, recall and F1 values in Table 1 below. The F1 score is a way of combining the precision and recall of the model, and is defined as the harmonic mean of the model’s precision and recall. You can find the formal definitions in Wikipedia, but intuitively, recall is ability of a model to find all the relevant cases, while precision is the quality of a model to correctly identify the right class (in our case this is the household size). For each metric a higher value is better, and the maximum value can be 1.0. In five classes out of six our model is the winner, and for the three-people class, the F1 results of our model are comparable to the winner.

Figure 3 (below) shows three different real households' energy usage via AMI data. A novice reader may think that by looking at the energy usage data, it would be easy to correctly guess the number of people living these households. You can see in Figure 4 that this is not the case: these households are not easily or linearly separable. The three examples shown here demonstrate that our model is sophisticated and powerful enough to correctly identify household size, particularly—and more importantly—on nonintuitive cases.

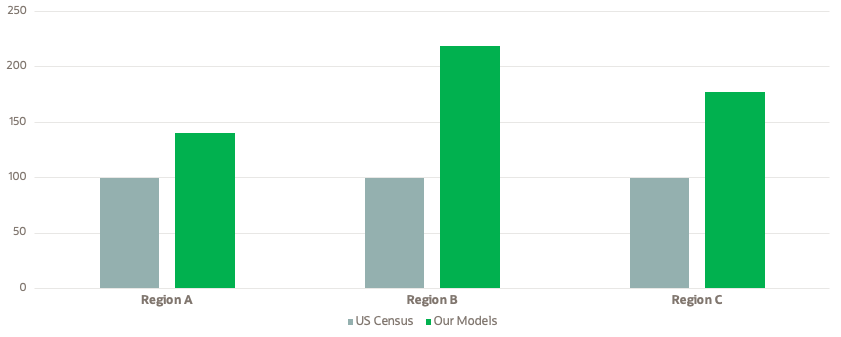
Figure 4 shows a head-to-head comparison on enrollment data predicting which households are enrolled in the LIHEAP program. We can see that in each region, our models predict more enrolled customers. As can be seen, the benefit of using our models is tremendous, reaching 149 percent, 177 percent and 219 percent when compared with the U.S. Census approach.

Low-income customers have trouble paying their utility bills. Our deep learning models—income, household size, and others--are helping utilities to find, reach, and enroll a lot more low-income customers in financial assistance and efficiency programs.