Using AI for Predicting Personalized Energy Burden and Gas Bill
Selim Mimaroglu, Director of Data Science and Machine Learning
Zheng Yang, Senior Data Scientist
Energy burden has several definitions, but the most widely accepted one defines it as the ratio of energy expenditure of a household to total income. Energy expenditure includes spending on utility bills, and excludes transportation and water costs. Energy efficiency insights and programs aim to keep energy burden at reasonable levels for all income levels by providing tips and insights that can be easily followed. Although low-income households use less energy per capita, in some cases it is well known that they may spend a considerably larger portion of their household income on energy bills. Oracle Energy and Water's UX team conducted a survey of likely low-income customers and found that 86 percent of participants were worried about affording their energy bills and a staggering 64 percent had received a shut off notice within the last year. Some studies (Davis 2021) estimate that 40 percent of low-income households find it difficult to pay their energy bills.
Why is energy burden important?
Energy burden is an important metric to follow for many reasons, as high energy burden may lead to energy insecurity with adverse consequences. Residential Energy Consumption Survey data for 2015 indicate that 31 percent of all U.S. households experienced some form of energy insecurity, and have had to reduce spending elsewhere, sacrificing essentials just to pay their energy bills. Adverse economic, financial and social consequences often take place when low-income households with high utility bills are making trade-offs between paying for food, medicine, shelter and utility bills. To compound the problem, failing to pay utility bills makes them vulnerable to potential shut-offs and evictions.
In the recent past, a variety of factors including the COVID-19 pandemic, climate-related events and a sustained disruption of world energy markets caused by Russia’s invasion of Ukraine have increased the energy burden for more and more people.
The data science team at Oracle Energy and Water leverages artificial intelligence (AI), especially deep learning, for predicting energy burden and gas bill at a personal, household level. For the reasons we explain below it is very important to predict energy burden accurately; unfortunately the data needed for these calculations is missing or incomplete. We have developed best-in-class modeling approaches for very accurate predictions. Here, we provide details of our models and some details for training and validation, and we also compare our models with the state of the art and list their many benefits.
Why is it hard to compute energy burden?
Unfortunately, it is hard to compute the energy burden metric accurately at the personal/household level for two major reasons:
- Missing gas usage data for heating, cooking, etc.
- Missing or incomplete income data
Some recent publications including Lin et. al. 2020 describe studies conducted with utilities and the adverse affects of missing, incomplete data sets. In the U.S., all households have some electric usage, as the most commonly used sources for heating are gas and electric: 48 percent of all U.S. homes use natural gas for heating, while electric heat is used in 37 percent, according to the US Census Bureau, and only about 15 percent use other sources such as fuel oil, propane, etc. (Magill 2014)
Our aim in working to predict energy burden is to have the highest impact by providing cutting-edge AI models to predict gas usage accurately; when gas and electricity usages are combined, we can account for 85 percent of heating customers within the U.S. Below, we will show prediction of gas usage from electricity usage, and some other readily available features. This work is not only novel and groundbreaking, but it also is necessary for computing the energy burden metric accurately. Our cutting-edge models open new doors for both researchers and practitioners who are interested in energy efficiency and energy poverty.
Predicting gas usage and gas bill accurately
Some households in the U.S. are metered and monitored using advanced metering infrastructure (AMI). This integrated system of smart meters, communication networks and data management systems is capable of providing data on total usage at finer granularities such as every 15 minutes or each hour. Although AMI is becoming more common—around 65 percent of U.S. homes now have smart meters (Walton 2021)—there are still millions of customers that haven't made the transition from conventional meters to AMI. For this reason we have developed deep learning models that can take either AMI or billing (non-AMI) electricity usage data as input, therefore our models can be applied to all electricity customers.
While some electricity customers use electricity as a heating resource, they might use gas for other reasons, such as cooking. In our training data set, which contains tens of millions of data points, there are data points with or without gas heating. In our validation, we compare our models' results on 'real and unseen' homes only: these are the homes that were not used in training. Note that our validation aligns very well with the real-life scoring scenario.
For gas bill prediction, we follow a two-step approach:
- In the first step, our AI models predict gas usage at a household level.
- In the second step, our models use gas rates from EIA 2022 as proxy to compute gas bill amount (if available you can use a gas rate engine to have more accurate results).
Gas rate engines provide better accuracy, but they are not always accessible or even available. For that reason, we are showing the results of our models using the available gas rates from EIA.
In the following section, we show our models in action, and provide the results on real and unseen homes (homes that are not part of our model training, as noted above).
Comparing with state of the art
To the best of our knowledge there aren't any machine learning models that can predict personalized gas usage from electricity input, so our contributions are novel. Unfortunately, we didn't come across any personalized rule-of-thumb gas usage or gas bill proxy numbers with which we can compare our results either. But, at the census tract level, which constitutes several hundreds or a couple thousand households, average gas consumption values are provided. These values provided by the U.S. Census, which are not personalized and not recent, are used in most cases to calculate energy burden. We compare our results with the census tract level, since U.S. Census tracts contain several hundred households and in the computations below we run our models on multiple households.
Let us start with single households, and show the model running on a real and unseen home using gas heating.


Figure 1 shows the gas prediction deep learning model in action, with prediction values (red) matching very closely with true gas values (blue). For the days in which heating is used, you can see that there is a considerable increase in the gas usage (which matches the expectations since this house is heated with gas). During the rest of the year the gas usage is a lot lower, but it is not zero. This indicates that gas is used in this household for other purposes as well, such as cooking. Figure 2 conveys a very similar story. Again this household is 'real and unseen'; since it is not heated by gas we don't observe much larger usage of gas in the winter months.


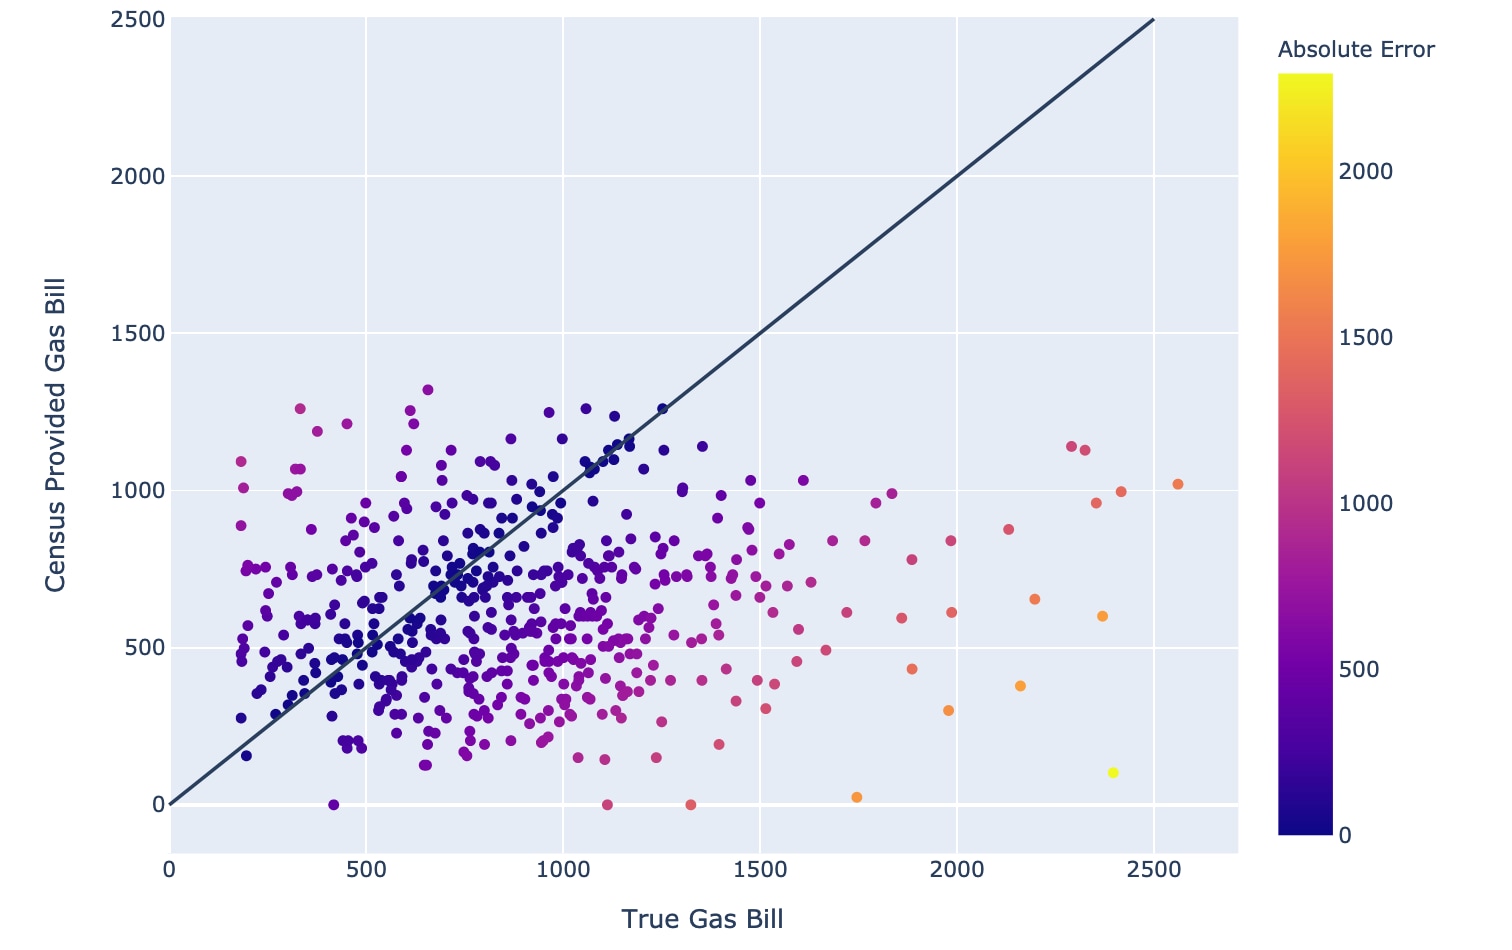
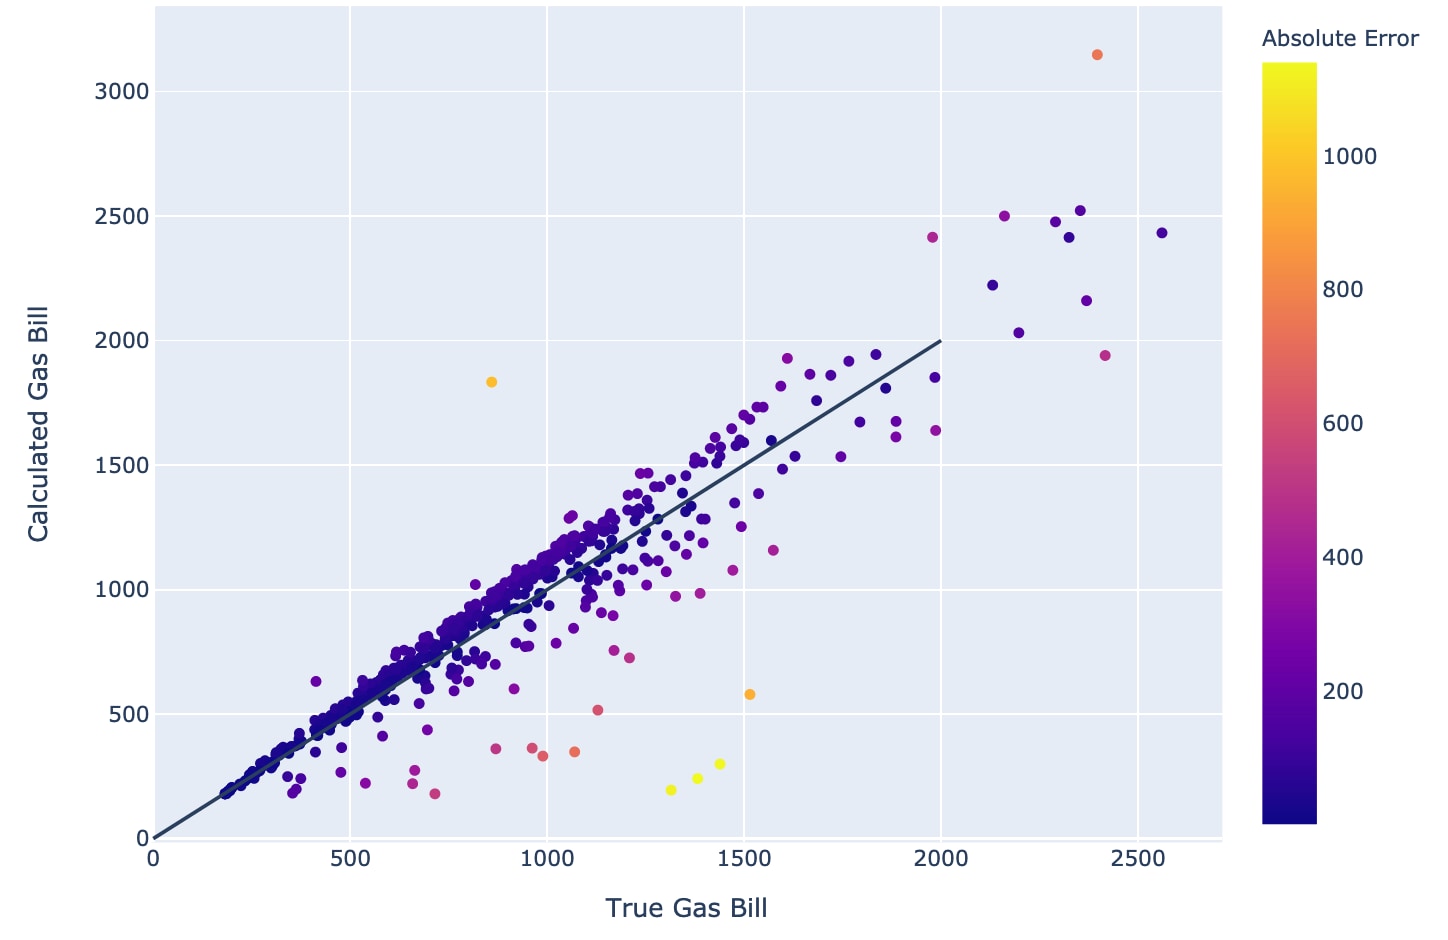
Figure 3 demonstrates a major problem when using U.S. Census tract values to predict household gas bills. These values, which are averages, fall short of being useful, and points far away from the diagonal line indicate large errors. To solve this problem we used our AI models for predicting gas usages and converted them into gas bills by gas rates from EIA. Note that using a gas rate engine would provide better, more accurate results, but such rate engines are not always available. In Figure 4 there is a very close alignment; computed gas bills by using EIA values are much closer to the true values, especially compared with the previous figure. Errors in this model are very reasonable, measured by any point's distance to the diagonal line.
Deep learning architecture and training metrics
We use Oracle Cloud Infrastructure (OCI), and OCI Data Science (OCI DS) for training, validating and scoring our models. OCI provides flexible and reliable computing with CPUs and GPUs. OCI Data Science promotes productivity and collaboration, it enables us to audit and reproduce models, and it makes it easy to put models into production.
For deep learning architectures, we evaluated novel architectures as well as most commonly used architectures in the literature, including ResNet, RNN and CNN combinations. We didn't need to use very deep architectures: keeping the number of model parameters at a reasonable level of around 60,000 helps us with training and scoring time. Using GPUs, total training takes around five hours with our AMI input model, and this number goes down to less than two hours while training with the billing input.
Our deep learning architecture combines and implements useful concepts from RNN, CNN, drop out and pooling. Through empirical studies we selected the best deep learning architectures having the least amount of error on our validation data.
Conclusions
The energy burden metric has been studied extensively, and has attracted a lot of good attention, especially in affordability-related programs. While some experts treat the energy burden metric as a first class citizen for identifying eligible customers, many others prefer to treat energy burden as a secondary, helper metric that is helpful for detailed analysis and insights.

| LIHEAP Eligibility Strategy | Recall |
|---|---|
| Energy Burden, true income | 0.62 |
| Energy Burden, income from US census | 0.17 |
Table 1: Low Income Energy Assistance (LIHEAP) eligibility overlap with energy burden metric
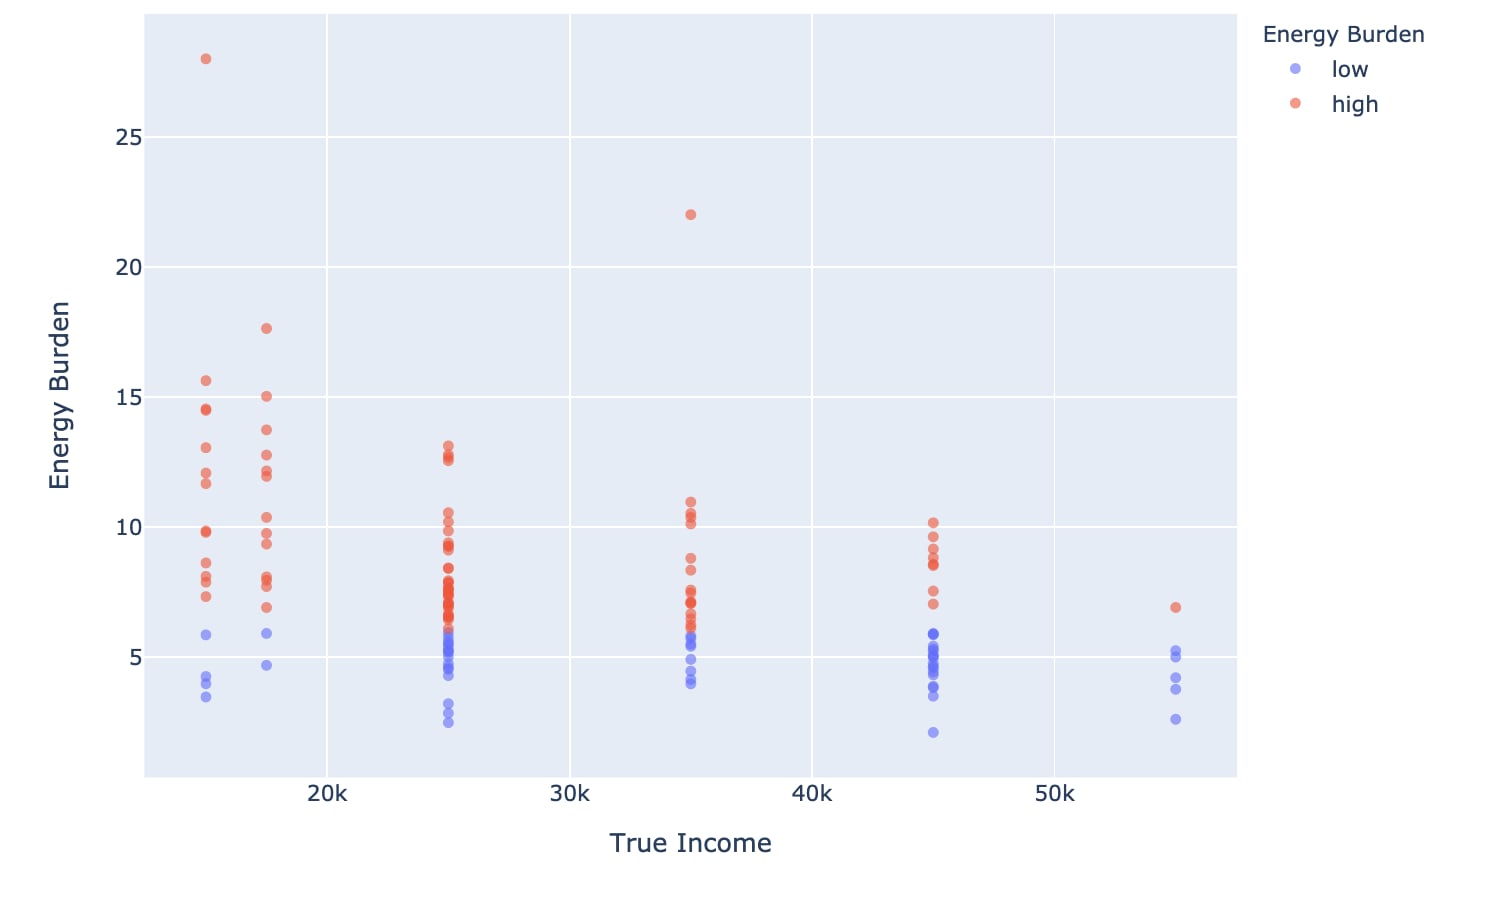
Figure 5 and Table 1 show that energy burden cannot solely determine Low Income Home Energy Assistance (LIHEAP) eligibility. LIHEAP, which is a federally funded and state administrated program, has eligibility criteria including income, number of people and age (in some states). Using energy burden as a primary indicator, only 62 percent of the eligible customers can be reached when true income is used, and true income is not available in most cases. When U.S. Census income data is used instead, recall drops down to 17 percent, as shown in Table 1. In Figure 5, we can see some low-income households having low and high energy burdens, labeled with blue and red respectively. Although energy burden is a very useful metric, it doesn't replace eligibility criteria in LIHEAP or similar programs.