Retrieving Data from Multiple Database Connections
Purpose
This tutorial covers assigning multiple database connections in a grid and populating a grid with data from multiple database connections with formulas.
Time to Complete
Approximately 30 minutes
Topics
This tutorial covers the following topics:
Overview
When you add a grid to a report, you specify its database connection. You can also populate the grid with data from multiple database connections. After defining the grid’s initial database connection, dimension layout, and members, you can change the database connection of data rows or data columns to retrieve data from another database connection.
When you change the database connection of data rows or data columns, the dimension names for the new database connection may be different from the grid’s initial database connection. You maintain the integrity of the data structure by mapping the dimensions from the initial database connection to the new database connection. If the structure of the new database connection differs from that of the grid’s initial database connection, the report cannot repopulate.
Limitations for multiple database connections in a grid:
- Database connections must be of the same type (for example, both must be Essbase database connections or both must be Financial Management database connections).
- Mismatched number of dimensions in the database connections may cause retrieval errors.
In a grid, you can also retrieve data from multiple database connections with formulas. You add multiple grids to a report, where each grid retrieves data from a different database connection. In one grid, you can then display data from another grid with formulas.
Scenario
In Reporting Studio, you add a grid in the report to retrieve data from a database connection. You add data rows and data columns to the grid. You also add rows to the grid that retrieve data from a different database connection. The multiple database connections in the grid must be of the same type and should have a similar structure.
To demonstrate a better way to retrieve data from multiple database connections in a grid, you add a second grid to the report. The second grid retrieves data from a different database connection. In the first grid, you then reference the data from the second grid with formulas. You use text functions to display the correct member names for the formulas and you hide the display of the second grid in the report.
Given the limitations of multiple database connections within one grid, the second solution with multiple grids is recommended.
Prerequisites
Before starting this tutorial, you should:
- Have access to multiple database connections, such as Essbase or Financial Management.
- Have access to Reporting Studio release 9.3.1 or higher.
- Have experience creating basic reports in Reporting Studio
Assigning Multiple Database Connections in a Grid
In Reporting Studio, you add a grid in the report to retrieve data from a database connection. You add data rows and data columns to the grid. You also add rows to the grid that retrieve data from a different database connection.
Limitations for multiple database connections in a grid:
- Database connections must be of the same type (for example, both must be Essbase database connections or both must be Financial Management database connections).
- Mismatched number of dimensions in the database connections may cause retrieval errors.
To populate a grid with data from multiple database connections, perform these steps:
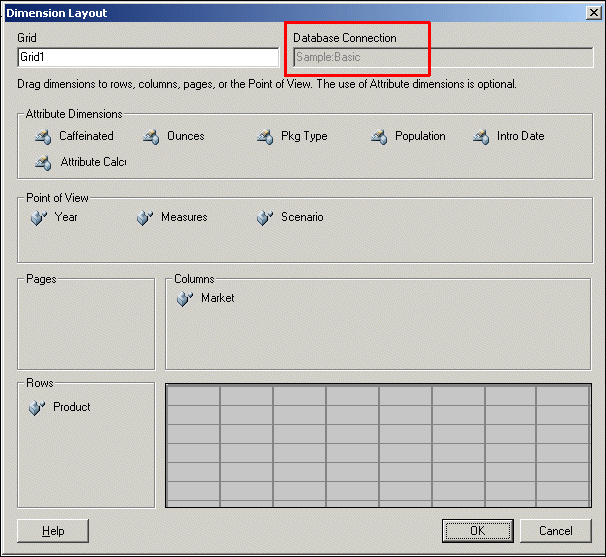
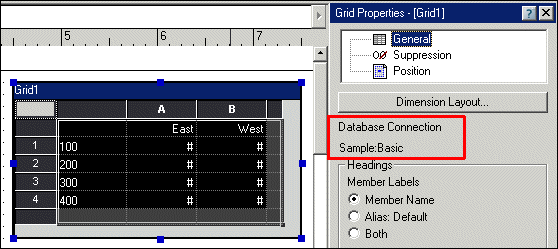
- In Reporting Studio, create a report and insert a grid. In this example, you select the Essbase database connection, Sample:Basic, add the Product dimension to the rows, and the Market dimension to the columns.
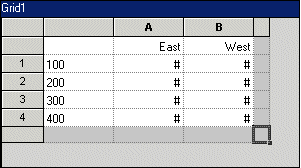
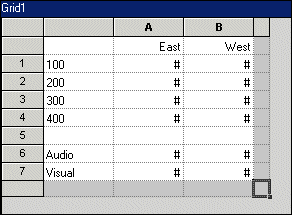
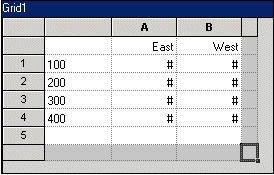
- For the Market dimension in column A, select East and West .
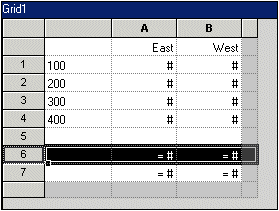
- For the Product dimension in row 1, select the 100, 200, 300, and 400 members.
- Grid1 displays the member selections.
- Select Grid1. In the General category of the Grid Properties sheet, verify that the database connection is Sample:Basic.
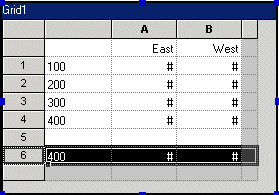
- At the bottom of the grid, add a text row and a data row. In this example, row 5 is a text row and row 6 is a data row.
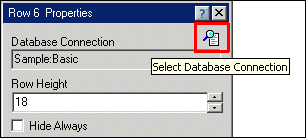
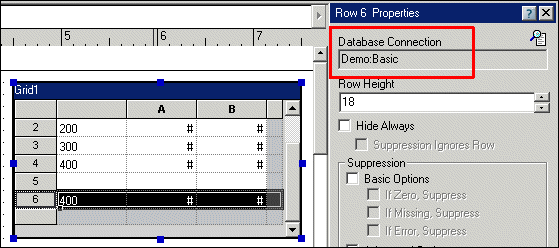
- Select row 6, and on the Row 6 Properties sheet, click Select Database Connection to change the database connection of row 6.
- In the Select a Database Connection dialog box, select a different database connection for row 6. In this example, you select the Essbase database connection Demo:Basic.
- Dimensions with the same name in both database connections are mapped automatically. You must map the dimensions that have different names. In this example, all of the dimensions between Sample:Basic and Demo:Basic are mapped automatically except for the Measures dimension. Map the Measures dimension from Sample:Basic to the Accounts dimension from Demo:Basic.
- In the Row 6 Properties sheet, verify that Demo:Basic is the database connection.
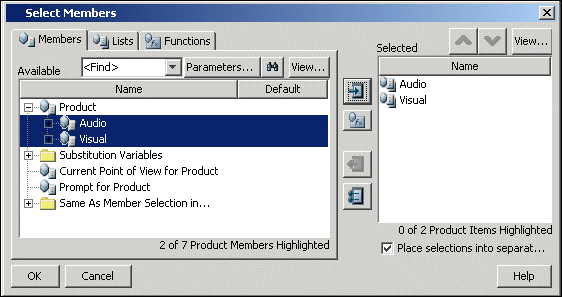
- For the Product dimension in row 6, open the Select Members dialog box. Verify that the available members are from the Demo:Basic database connection, and select the Audio and Visual members.
- In Grid1, the first 4 rows are members from the Sample:Basic database connection, and the last 2 rows are members from the Demo:Basic database connection.
- In the user POV bar, set the Point of View for the database connections.
- Preview the report. The report retrieves 4 data rows from Sample:Basic and 2 data rows from Demo:Basic.
By default, row 6 retrieves data from the Sample:Basic database connection.
You do not map dimensions that are in the Point of View.
For Sample:Basic, select these user POV members:
| Dimension | Member |
|---|---|
| Year | Year |
| Measures | Profit |
| Scenario | Actual |

For Demo:Basic, select these user POV members:
| Dimension | Member |
|---|---|
| Year | Year |
| Measures | Profit |
| Scenario | Actual |

Populating Grids with Data from Multiple Database Connections with Formulas
To demonstrate a better way to retrieve data from multiple database connections in a grid, you add a second grid to the report. The second grid retrieves data from a different database connection. In the first grid, you reference the data from the second grid with formulas. You use text functions to display the correct member names for the formulas and you hide the display of the second grid in the report.
To populate a grid with data from another grid by using formulas, perform these steps:
- In Grid1, delete rows 6 and 7.
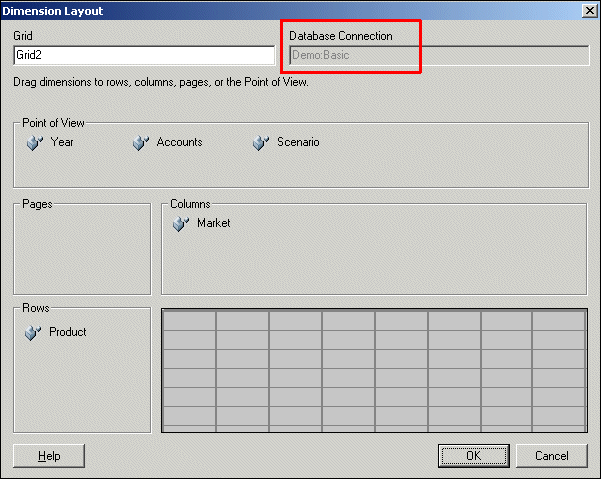
- Insert a second grid in the report to retrieve data from a different database connection. In this example, you select the Demo:Basic database connection.
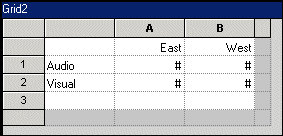
- For Grid2, place the Product dimension in the rows and the Market dimension in the columns.
- In the columns of Grid2, select the East and West members. In the rows, select the Audio and Visual members..
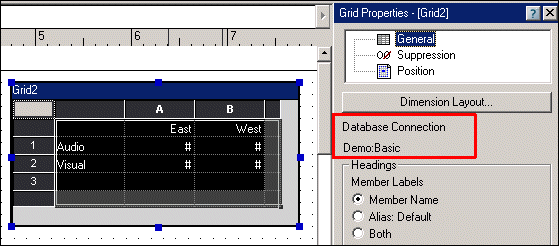
- Select Grid2. In the General category of the Grid Properties sheet, verify that the database connection is Demo:Basic .
- Return to Grid1. At the bottom of the grid, add two formula rows.
- In rows 6 and 7, you add formulas to retrieve data from the Demo:Basic database connection in Grid2.
- In rows 6 and 7, you add text functions to retrieve the member names.
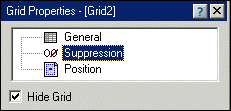
- To hide Grid2 from the report display, select Grid2, and in the Suppression category of the Grid Properties sheet, select Hide Grid.
- Preview the report.
In row 6, enter the formula Grid2.row[1] to retrieve the data from row 1 of Grid2.
In row 7, enter the formula Grid2.row[2] to retrieve the data from row 2 of Grid2.

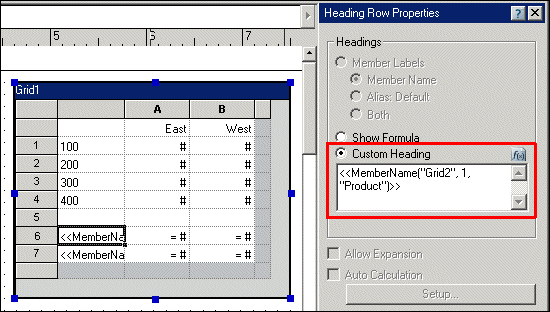
Select the heading for row 6. On the Heading Row Properties sheet, select Custom Heading. In the Custom Heading box, enter the MemberName function to retrieve the member name from row 1 of Grid2. The function syntax is <<MemberName("Grid2", 1, "Product")>>. The dimension name must be spelled exactly as it is in the database.
Repeat this step for row 7 to retrieve the member name from row 2 of Grid2. The function syntax is <<MemberName("Grid2", 2, "Product")>>.
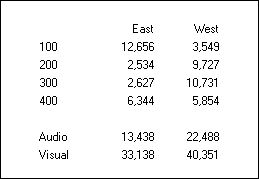
In the first 4 rows, the report displays data from the Sample:Basic database connection. In the last 2 rows, the report displays data from the Demo:Basic database connection.
Summary
In this tutorial, you've learned how to:
- Assign multiple database connections in a grid
- Populate grids with data from multiple database connections with formulas
Related Information
- To learn more about populating reports with data from multiple database connections, refer to the Oracle Hyperion Financial Reporting Studio, Fusion Edition Release 11.1.1 User’s Guide