Using Oracle Machine Learning Notebooks
Acme Corp. changes course by tying machine learning to Oracle Autonomous Data Warehouse.
By Arup Nanda | February 2021

[This is an updated version of an article published by Oracle Magazine in 2019.]
Acme Corp., an online seller of high-end merchandise, is currently in a bind. Sales are dropping, advertising costs are soaring, and the CEO is understandably disturbed. She calls a meeting of the top people from the data, products, marketing, and sales departments to brainstorm about how to increase sales. Everyone is confident that Jane, the new chief data scientist at Acme, will be able to come up with something.
Violet, the marketing manager, starts off by saying that advertising costs have gone up. To reduce them, Acme must know exactly which segments of the customer base will buy what products and then advertise to them directly instead of using the current shotgun approach of trying to reach everyone. She wants to know if there is a quick way to do that.
In the past, Acme’s data scientists had to download data from the database to their local machines to analyze it with the R and Python languages. But the data was often stale, because it had to be moved from the database, and it required strong expertise in R and Python. Most data users at Acme are familiar with SQL, and that’s the language they want to use. The data users want to know if that is possible without learning Python and R, but they still want the ability to use these languages.
Jane says they can use SQL without learning Python and R, but they can use those languages if they want to. Acme uses Oracle Autonomous Data Warehouse, which has built-in analytics and machine learning (ML) modules. This enables Jane to perform analytics computations inside the database without moving the data. In this article, you will learn how Jane does the data analysis.
Setup
To demonstrate the concepts used by Jane, this article uses the SH sample schema that comes with Oracle Autonomous Data Warehouse. There are two tables in this schema: SALES, which shows sales fact data, and SUPPLEMENTARY_DEMOGRAPHICS, which shows the demographics data for each customer. Acme uses a loyalty card that offers discounts to returning customers, hoping they will spend more. Jane is tasked to figure out which specific demographic data items will most influence customers to spend more.
This article assumes that you know a little bit about Oracle Autonomous Data Warehouse, and it’s beyond its scope to explain all Oracle Autonomous Data Warehouse concepts. If you are already familiar with Oracle Autonomous Data Warehouse and are using it now, you can skip ahead to the “Oracle Machine Learning Notebooks” section.
If you have access to Oracle Autonomous Data Warehouse, great; but if you don’t and you want to follow the steps in this article, Oracle makes it easy for you. You can sign up for a trial account at oracle.com/cloud, which will enable you to spend up to US$300 in free credits from Oracle. After you sign up, you will receive an email from Oracle Cloud with a temporary password. Figure 1 shows the top of the Oracle Cloud homepage.

Figure 1: Oracle Cloud homepage top banner
If you want to start a cloud trial, click Try for Free. You will be asked to designate a name for your cloud account, which needs to be unique. In my case, I used the name arup.
After you get your password via email, click Sign In (see Figure 1), sign in with the temporary password, and then immediately change it to the password you want. Henceforth you will see the sign-in screen shown in Figure 2.

Figure 2: Sign-in screen
Always remember to choose Cloud Account with Identity Cloud Service and the cloud account name (arup in my case).
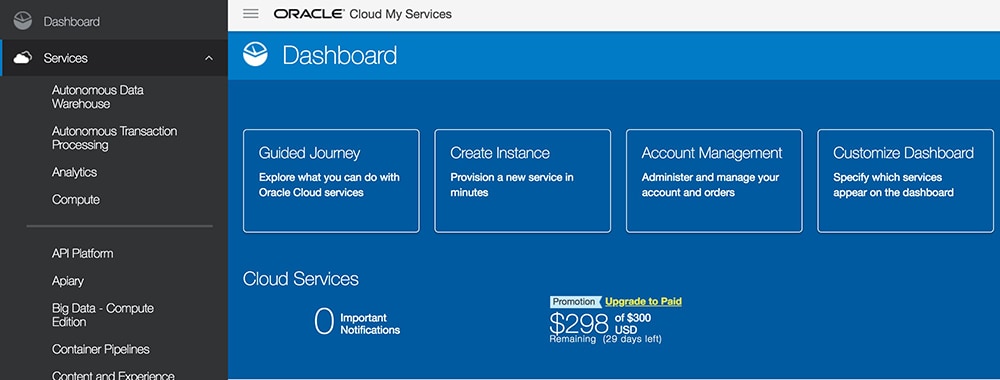
Once logged in, you will see a screen similar to the one in Figure 3. Click the hamburger icon ( ) to the left of the words Oracle Cloud My Services, which will pull up a menu on the left (also shown in Figure 3). Click Oracle Autonomous Data Warehouse, and you will see a screen similar to Figure 4.

Figure 3: Oracle Cloud dashboard

Figure 4: Oracle Autonomous Data Warehouse dashboard
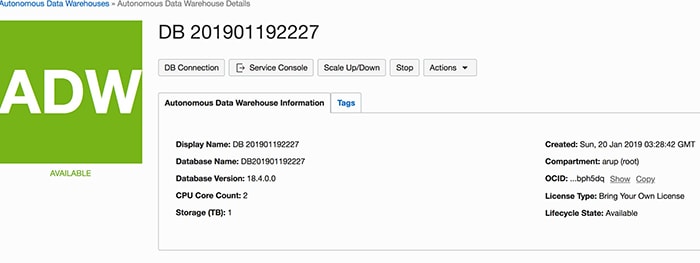
Click the Create Autonomous Data Warehouse button. You will see a very small set of questions. Answer the questions and click Create. The data warehouse will be created in a matter of minutes. After the data warehouse is created, you will see it listed on the same screen (Figure 4). Now click the name (DB 201901192227 in my case) to bring up a screen similar to the one shown in Figure 5.

Figure 5: Autonomous Data Warehouse management screen
Click the Start button to start the data warehouse. When the data warehouse starts, the button changes to Stop (which is what is showing in Figure 5). After the data warehouse starts, the big ADW icon on the left turns green and shows AVAILABLE.
At this point, to connect to the data warehouse, click the DB Connection button, which will bring up a window that includes the Download Client Credentials button. Click that button to download the configuration file, which you will use to connect to the database from an Oracle client.
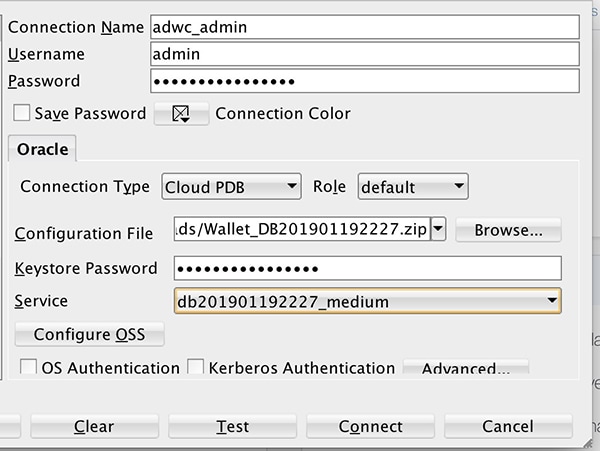
To connect from Oracle SQL Developer, for example, use the configuration shown in Figure 6.

Figure 6: Oracle SQL Developer connection
When you connect to the data warehouse from Oracle SQL Developer, you can see the included SH sample schema and all the tables in it. Test some simple statements, such as the following, to make sure your connection is valid:
select * from sh.sales;
Oracle Machine Learning Notebooks
Acme has already set up Oracle Autonomous Data Warehouse, so Jane moves on to the challenge at hand. Someone in the meeting brings up an interesting point. Most data scientists are used to the concept of a notebook, which enables them to store SQL statements one after the other and store the results of the statements right afterward. (Examples of notebooks include Jupyter and Apache Zeppelin.) Couldn’t Acme use a notebook? Someone points out that moving the data from the cloud to a local system (where Oracle SQL Developer runs) may not be the best in terms of latency, especially when the data volume is high.
Jane explains that there is a simple solution. Oracle Autonomous Data Warehouse comes packaged with a web-based notebook server, based on Apache Zeppelin, which enables data scientists to collaborate by entering SQL in a common notebook and by sending their own notebooks to one another. To show how to use the built-in notebook server, she clicks the Service Console button on the screen shown in Figure 5. This opens the service console in a different window. Jane warns that if pop-ups are blocked in the browser, this will not work. The service console shows various stats on the service, such as CPU usage, the number of SQL statements, and the average SQL response time. On the left is a menu item called Administration, shown in Figure 7. She clicks that item and the Manage Oracle ML Users panel to the right of it.

Figure 7: Autonomous Data Warehouse administration
On the Manage Oracle ML Users screen, Jane sees all the users defined for Oracle Machine Learning. She creates a few users on this screen, including one called ARUP. Then she clicks the Home icon on that screen to enter Oracle Machine Learning, using the username and password she just created. This brings up a screen similar to the one shown in Figure 8.

Figure 8: Oracle Machine Learning home
On this screen, Jane can create notebooks and run them. She clicks the Notebooks icon, which brings up a screen showing all the notebooks created; then she clicks Create to create a new notebook; and she names it Acme Attribute Effect. The notebook shows only a single box at this point, as shown in Figure 9.

Figure 9: New notebook
In the blank entry, Jane can enter any SQL or PL/SQL code. Then she clicks the right-arrow icon next to the word READY. The output of the statement will come right below the statement—that’s how notebooks work. This enables a user to quickly test a statement and also record it so someone else can look at both the statement and the data.
Attribution analysis
Next Jane turns to the original question posed by the marketing department: how to better identify the customers who will buy more products, so it can advertise to them directly, offer discounts, and increase sales.
Here are the two tables (both in the SH schema): SALES shows all the sales data for a customer, including two very important columns:
AMOUNT_SOLDis the actual value of the goods sold.PRODUCT_IDis the unique product identifier.
SUPPLEMENTARY_DEMOGRAPHICS shows all demographic data on the customer, including the following columns:
AFFINITY_CARDis the likelihood that a customer will respond to the loyalty program discount and spend more money. 1 means yes; 0 means no.EDUCATIONis the highest education the customer has received.OCCUPATIONis the customer’s occupation.HOUSEHOLD_SIZEis how many other people live in the same house as the customer.YRS_RESIDENCEis how many years the customer has been staying in the current residence.
The important data point here is the AFFINITY_CARD value. And the question is which of the other demographic and sales data has the highest influence on the AFFINITY_CARD value. When that is known, the marketing team can tailor its campaigns accordingly.
Attribute ranking
There’s more than one way to solve most problems, Jane reminds everyone in the room. Oracle Autonomous Data Warehouse offers many utilities to perform machine learning on the data. Jane offers to show one of those utilities—Attribute Ranking Functionality—in which the machine learning model identifies the strength of any correlation between the various attributes and ranks them in order of influence on the dependent variable. In Oracle Autonomous Data Warehouse, the utility is available through functions of the DBMS_PREDICTIVE_ANALYTICS package. One such function is called EXPLAIN, which computes the rank of the attributes influencing the dependent variable, which is AFFINITY_CARD in this case.
Jane pulls up the notebook and enters the following simple SQL statement to show all the records from SUPPLEMENTARY_DEMOGRAPHICS:
select * from sh.supplementary_demographics
Then she clicks the execution button (the right-arrow icon). Figure 10 shows the SQL statement, the execution button, and the output.

Figure 10: Notebook first step
This is how a notebook functions, Jane tells her audience. The SQL statement is entered in a field, which is called a paragraph. The output comes immediately afterward. The user can modify the paragraph but not the output. Another paragraph opens up just under the output, where the user can enter another command, which can be in SQL or PL/SQL.
To facilitate her analysis and make it simpler for the audience to understand, Jane decides to combine the multiple data elements into a single table, via the following SQL script:
create table demo_sales as
select d.cust_id, s.prod_id, s.amount_sold, d.affinity_Card, d.education, d.occupation, d.household_Size, d.yrs_residence
from sh.supplementary_demographics d, sh.sales s
where s.cust_id = d.cust_id;
The best part of using the notebook is that she can enter this SQL right there in the notebook, in one of the paragraphs. She creates the DEMO_SALES table and selects the data from it in the next step, as shown in Figure 11.

Figure 11: Creation of the DEMO_SALES table
Then Jane performs the most important part of the exercise: ranking the influence of the attributes (all the columns of the DEMO_SALES table) on the AFFINITY_CARD column. She invokes the EXPLAIN function, as described above, by entering the following in the next paragraph:
%script
begin
  dbms_predictive_analytics.explain(
    data_table_name     => 'DEMO_SALES',
    explain_column_name => 'AFFINITY_CARD',
    result_table_name   => 'OraMag_Explain_Output');
end;
/
The %script reference in the first line tells the notebook that it’s a PL/SQL script and not a SQL statement. The notebook executes the function and stores the results in a table called OraMag_Explain_Output, which is created by this execution. The final act is simply to select from this table to discover the rankings. Jane enters the following in the next paragraph:
select attribute_name, rank, to_char(explanatory_value,'9.99999') explanatory_value
from OraMag_Explain_Output
order by rank, explanatory_value desc
The output in the notebook is shown in Figure 12. Jane explains the output to her audience. The RANK column shows the ranking of the influence of that attribute on the AFFINITY_CARD column. So the output says that the HOUSEHOLD_SIZE column is the highest-ranking in influence on the AFFINITY_CARD column. The next-highest ranking one is YRS_RESIDENCE, and so on.

Figure 12: Rankings
To make the chart more effective for presentation, Jane clicks the bar chart icon, just above the output. It shows the same data, but as a bar chart, with each bar’s height representing the EXPLANATORY_VALUE column, ordered from the highest to the lowest ranks, as shown in Figure 13. A picture is worth a thousand words, and this one is no exception.

Figure 13: Bar chart
The EXPLANATORY_VALUE column is very important, Jane explains. The value is a number between 0 and 1, and a value of 0 means that the columns are not correlated at all. Pointing to the output, Jane explains that the PROD_ID column is not correlated and should be discarded from the analysis. A value of 1 means that the columns are perfectly correlated, but that is a very rare occurrence.
The marketing folks got their answer—they need to focus on household size and years in a residence, followed by the other attributes and not focus on product IDs or individual customers.
Although everyone is impressed with the initial findings, all agree that this is not the end to their quest to improve sales. A typical problem involving machine learning has to go through multiple models and iterations to find the answers. Jane explains that her demonstration was meant to showcase how easy it was to find a key answer with the built-in machine learning functionality in Oracle Autonomous Data Warehouse, however.
Advantages of notebooks
Someone in the room points out that all of the work was done in SQL and PL/SQL and could have been done with a simple client application such as Oracle SQL Developer. What was the point of doing it in a notebook?
Jane concedes that this is a fair question and goes on to explain why a notebook approach may be better:
- Large swaths of data need not be transferred to the user’s client application from the cloud. Notebooks are on a notebook server in the cloud.
- The notebooks store the statements and the results together and can be examined without re-execution of the statements. Jane clarifies that she can re-execute the statements anytime to get the most-recent data.
- The notebooks can be shared with other team members, and multiple people can collaborate to produce a single notebook.
- Notebooks can be turned into jobs, which can execute all the statements in the notebook in the same sequence automatically and produce the results as the last step. This is important when the data pattern changes. A job will automatically execute all the steps and get the final result.
Conclusion
The most important point, Jane reminds everyone, is that all these analyses were done right inside the database, with no data transfers to any outside systems. Second, the analyses were done with Oracle Database–resident packages with plain SQL—no R or Python expertise was required. And this is merely scratching the surface, she adds. Oracle Autonomous Data Warehouse provides plenty more utilities and tools for machine learning and data science, and she lets the audience know that she will send everyone there a link for more information on Oracle Machine Learning. The audience leaves the meeting impressed and happy.
Dig deeper
- Oracle Machine Learning Notebooks
- Managing an autonomous database
- Machine learning—defined
- Oracle Machine Learning examples on GitHub
- What’s the difference between AI, machine learning, and deep learning?
- How does AutoML impact machine learning?
- Book review: Machine Learning: Hands-On for Developers and Technical Professionals, 2nd Edition
- Always Free cloud services
Illustration: Oracle

Arup Nanda
Arup Nanda has been an Oracle DBA since 1993, handling all aspects of database administration, from performance tuning to security and disaster recovery. He received an Oracle Excellence Award for Technologist of the Year in 2012.