
Technical Article
Automating Java Performance Tuning
by Carl Brahms
Published September 2008
Why automating the load generation and performance tuning process can save a lot of time and effort.
Tuning can be a very difficult and time-consuming experience, especially for environments that demand the best performance. The benefits of good tuning are a more stable environment, less outages, and better overall performance. If you're lucky enough to have an in-house performance tuning staff and a dedicated performance tuning environment, you're in a rare position. If you're like the rest of us whose performance tuning efforts are squeezed into shrinking windows of time, this article will show you how automating the process makes it easier, quicker, and more comprehensive than doing it by hand.
Basic Principles of Performance Tuning
Java performance tuning is an ongoing—and often long, and frustrating process. Rarely can tuning solve performance problems with one shot. Sometimes you might have trouble reaching your ideal performance no matter how much hardware you add, or how many hours you spend trying obscure memory arguments. To produce the best performance to start with, you need clear performance goals, a well-thought out design, a solid implementation, and lastly thorough performance tuning.
Start with Clear Performance Goals
Before taking any steps to optimize your performance, you need to determine what your goals are. This is because of the fact that the expected behavior and number of users, amount of data, and size of requests largely determine what type of decisions you will make in tuning. Every environment is unique, and a clear understanding of what the application and environment limits are as well as what level of performance and load you're aiming for will help you down the line when you're deep into the process.
Tune WebLogic Server Settings
There are literally hundreds of WebLogic settings you can adjust: pool sizes, tuning connection backlog buffering, caching, JDBC and JMS settings, setting priorities with work managers, clustering, etc.
Find the Bottlenecks
The problem isn't always with the JVM or WebLogic settings. Make sure the proper OS and network settings are tuned for the application's requirements, especially if using UNIX or Linux. Monitor your server's disk and network I/O and CPU utilization while under load. Your database block size, pool size and other vendor-specific performance tuning settings should also be examined if database performance is lacking. Any underlying resource constraints can cause significant performance degradation.
And keep in mind, the whole point is to simply meet your performance goals, not to eliminate every single bottleneck. There will always be a bottleneck or a slowest part of the system, but what matters is meeting your performance goals and keeping customers happy.
Tune Your Application Code
It may be obvious to state this but, applications need to be designed with performance in mind. It's easy in today's SOA environments for applications to grow to become too complex and full of performance impacting issues. Poorly designed applications can be the cause of system resource, network or database bottlenecks. Design your application using proven performance patterns and keep it simple.
Tune Your Heap
No matter what your application is, if you're running low on heap or spending a high percentage of time garbage collecting, you should try adjusting the size of your overall heap and its generations. Application performance is often helped or hindered significantly by the size of the available heap.
Finding the right heap size for your WebLogic servers is essential for good performance. As a general sizing rule, you want to have around half the heap free at the end of each garbage collection. Another way of saying this is the heap should be at least two times the size of its live objects.
Perhaps the most basic of heap performance tuning steps is to set the minimum and maximum heap size to be equal. This recommendation is also relevant to setting the New generation size in Sun HotSpot, or the Nursery size if you're using Oracle JRockit. By default, the JVM wastes resources constantly growing and shrinking the size of the heap.
Don't be afraid to experiment and try setting the size as large as your system can handle, minus the memory needed for OS and other applications. A larger heap reduces the frequency of garbage collection but might take longer to execute the larger garbage collections.
The VM always uses more memory than the heap size to handle the native libraries and permGen (in the case of Sun HotSpot), so be careful not to exceed the total size of the physical RAM. OS paging memory to disk will drastically reduce performance.
Try Garbage Collectors
Garbage collection is the mechanism used to reclaim heap space from objects that are no longer being used. There are a variety of garbage collection schemes that vary from JVM to JVM, and they all use system resources in different ways. Your job in the tuning process is to identify what type of garbage collection scheme works the best for your particular application and performance goals. The goals you have in choosing a collector are minimize garbage collection pause times, and improve the garbage collection throughput.
For information how to use JRockit's garbage collection schemes, see the section on "Selecting and Tuning a Garbage Collector". For a detailed overview of the garbage collection schemes available with Sun's HotSpot VM, read Sun's Tuning Garbage Collection with the 5.0 Java Virtual Machine.
Other Considerations
There are many specific JVM performance options offered by the JRockit and Hotspot JVMs. The list of performance impacting WebLogic settings alone is a mile long. What is most essential for productive tuning is getting the developers, architects, system engineers, QA testing, network engineers and DBAs to work together as a team. Having a cross-discipline participation in the tuning process can make for shorter work, better results, and ultimately reduce the cost and time it takes.
The Benefits of Automation
Now that we've gone over a few of the basics of WebLogic performance tuning, let's look at how automating these tasks can really make the process of performance tuning easy, less time-consuming and more effective.
Rapid Changes, Frequent Tuning
I've seen time and time again that automating the process of performance tuning produces much better results than experts can do alone. This is mainly because the automated process can rapidly make changes and identify and measure the impact on performance, faster and more comprehensively than the most caffeinated human is capable of. And, with tuning becoming an effortless process, you can tune for every code release and keep pace with the application changes. Too many performance problems are introduced by minor changes to the functionality of the application that nobody predicted would impact anything.
Also, many people incorrectly assume that tuning is optional because their current response times are sufficient. It's easy to overlook the fact that proper tuning increases the stability and longevity of a server. Outages can be caused by not tuning or by tuning incorrectly, and a properly tuned environment runs more predictably and is more stable.
Saves Your Time and Untapped Performance
We often don't tune our servers frequently or thoroughly enough, simply because the process is so time consuming. When you automate the process, days of manual effort can be done overnight, without intervention. Staff that was previously spending countless hours tuning can spend their time in more productive ways.
The financial savings from automating Java tuning add up quickly when you are having less outages, better performance, proper hardware utilization, and by freeing you up to do more of your job and less "grunt work". Often micro-second gains in performance in today's demanding environments translates to significant resource savings.
Learn by Seeing
It's enlightening to see how both code changes and different tuning variables affect performance. Automating both the tuning and analysis lets you try a more diverse combination of settings, and with proper monitoring in place, you can see the results side-by-side. It's like standing over the shoulder of a team of performance experts; you begin to learn why certain tuning decisions were made, making it a very educational process.
Being able to easily tune your servers for every code release is also a wonderful byproduct. You have the peace of mind from knowing there will be no surprises when it's time to deploy to production.
Automated Tuning, Step-by-step
In this section you'll learn the process of using Arcturus Applicare's Tune Wizard to find the best performing JVM settings. In the interest of time, I'll be demonstrating the process of testing a variety of garbage collection settings.
In a nutshell, Tune Wizard kicks-off your load tests, monitors the servers, analyzes the behavior, makes decisions based on embedded intelligence, tunes the configuration and bounces the servers. This process is repeated, automatically adjusting various JVM, OS and WebLogic settings until it finds the best performing combination. Following is a break-down of each step.
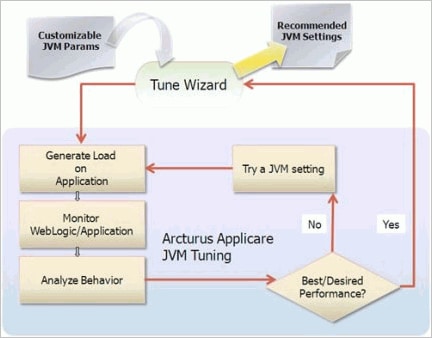
Figure 1. The process of automated JVM tuning
Because tuning becomes so easy when you automate it, you can quickly find yourself wanting to fine tune and experiment. In Tune Wizard, there are a number of advanced options that give you control over resource utilization that I'll mention more about later. As in any performance tuning process, you'll need to know a little about the application behavior. If your application has a warm-up time or initial caching time period, you need to make sure you run load for a sufficient period of time to get accurate results.
Choose Load Test Settings
Tune Wizard integrates with Apache JMeter, HP Load Runner and The Grinder load generation tools and it is also able to fire load generated from your own custom Java applications and shell scripts. I didn't have a load tool set-up or any load scripts generated yet, so I used JMeter (it comes included) to record a test script by following these instructions.
Starting up Tune Wizard, I specified the load script and it allows me to customize how many users to simulate. I selected 70 users for this test, because I know from previous tests that's about when the performance of my application starts to degrade.
The first time you tune your servers, you may not know how many users your application can handle before performance starts to drop. If I didn't know how many users my environment could handle, I could use a neat feature called capacity determination (Figure 2) before taking a guess and buying more servers. The purpose of capacity determination is to find the perfect balance of good throughput without exceeding your resource utilization limits. Capacity determination allows you to set an initial and max number of users to try, and while tuning it will increase the load until a sweet spot is found between the throughput and resource utilization.

Figure 2. Automating capacity determination
Choose Test Conditions
Next you need to select the number of monitoring samples to take for each tuning session and the interval of time between them. As I mentioned before, if your application has a warm-up time or initial caching time period, you can adjust the settings here to make sure the test duration is long enough to get an accurate baseline. I selected 20 samples per session, 60 seconds apart.

Figure 3. Since every application varies, you can tweak the number of samples and their interval as needed so you can capture an accurate baseline.
Click "Go"
Now all that's left to do is sit back and relax. You can also schedule the tuning to start anytime, so you don't have to be present if you want tuning to begin later in the off-hours. Tune Wizard will try each of these settings, and when tuning is complete, Tune Wizard generates a report with recommendations on what settings gave you the best performance.
While the server is under load, Tune Wizard monitors the server's performance and health. It does this by looking at throughput, heap information, CPU utilization, threads, waiters, queues—basically everything you'd be watching if you were running the load test yourself. The frequency and time between samples can be set and customized when starting the tuning session.
This is one of the most interesting and valuable aspects of Tune Wizard and the other features of Applicare. It comes with an artificial intelligence engine that makes intelligent performance tuning decisions. The knowledge base is built from the combined experience of performance tuning consultants, proven tuning methodologies, and best practices. It is capable of looking at the data generated during the load test and making intelligent decisions about what to tune next. Once Tune Wizard has arrived at the best possible combination, it will end the tuning.
I can watch the progress charts live in the Applicare console or I can wait until the test ends and view the reports. If you want to check the data to draw your own conclusions, there is an extensive list of reports and charts showing complete details on the behavior of each of the tuning settings.
The Results
Here I briefly discuss the results from the tuning, show some of the charts Applicare created about the tuning sessions, and discuss some additional recommendations that were made by Applicare. This wasn't an exhaustive tuning exercise by any means, but it shows what Tune Wizard can do in a short time with a little load. The tuning process took 4 hours to complete, it tried 9 different combinations of settings, tuning the JVM settings and other settings, including threads, JDBC settings, etc. Tune Wizard looks for areas of the configuration that are either under-sized or over-sized and sets them appropriately. Out of the parameters I gave to Tune Wizard to try, the best performing was:
-Xms512m -Xmx512m -XX:CompileThreshold=8000 -XX:PermSize=48m
-XX:MaxPermSize=128m  -Xverify:none -XX:NewRatio=3
-XX:SurvivorRatio=6 -XX:+UseParallelGC
Applicare has a selection of charts to show the tuning results, in the interest of space, I'm showing the throughput and heap charts showing the before/after. You can see the heap utilization is lower and the major GC pause times are less. You can also see that the throughput dropped at the same time as the major GC occurred, showing that our initial settings before tuning would result in long pause times during major GCs.
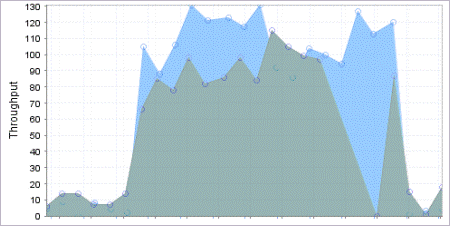
Figure 4. This chart shows the throughput after tuning (blue) was better than before tuning (green) .
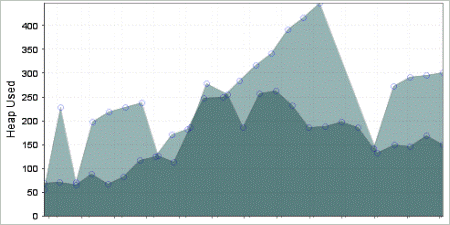
Figure 5. A comparison of the heap utilization between sessions. The end result after tuning was lower memory usage.
Other Recommendations
Applicare also detected problems in the application's runtime behavior and server configuration. It detected that EJB cache was inappropriately configured, and suggested increasing the cache size.
Furthermore, Applicare's diagnostics reported that during the tuning process the number of open sessions was high enough to impact performance (more than 17,000 in some cases). It pointed out the instances where the Session Invalidation Interval Seconds of some of my application's webapps was set too high, and recommended reevaluating to avoid keeping inactive sessions open for too long.
The nice thing is I didn't have to guess or hunt for these bottlenecks, they were presented clearly by the tool.
Advanced Options
Tune Wizard comes with pre-defined options for each of WebLogic's supported JVMs to try that are aimed at finding the best garbage collector for your environment, but it also gives advanced users the flexibility to try any options they want. For this test, I tried some of my own settings and it found the best performing one in just a few hours, saving me tons of effort.
applicare.jvmparams.param6= -Xmn256m -Xss128k -XX\:+UseConcMarkSweepGC
-XX\:+UseParNewGC -XX\:SurvivorRatio\=8 -XX\:TargetSurvivorRatio\=90
-XX\:MaxTenuringThreshold\=3 -Xms512m -Xmx512m -XX:CompileThreshold=8000
-XX:PermSize=48m  -XX:MaxPermSize=128m  -Xverify:none
applicare.jvmparams.param5= -Xmn256m -Xss128k -XX\:+UseParallelGC
-XX\:+UseParallelOldGC -XX\:+UseBiasedLocking -Xms512m -Xmx512m
-XX:CompileThreshold=8000 -XX:PermSize=48m  -XX:MaxPermSize=128m
-Xverify:none applicare.jvmparams.param4= -Xmn256m -Xss128k
-XX\:+UseParallelGC -XX\:+UseParallelOldGC -Xms512m -Xmx512m
-XX:CompileThreshold=8000 -XX:PermSize=48m  -XX:MaxPermSize=128m
-Xverify:none applicare.jvmparams.param3= -XX\:NewRatio\=3
-XX\:SurvivorRatio\=6 -XX\:+UseConcMarkSweepGC -Xms512m -Xmx512m
-XX:CompileThreshold=8000 -XX:PermSize=48m  -XX:MaxPermSize=128m
-Xverify:none applicare.jvmparams.param2=-XX\:NewRatio\=3
-XX\:SurvivorRatio\=6 -XX\:+UseParallelGC -Xms512m -Xmx512m
-XX:CompileThreshold=8000 -XX:PermSize=48m  -XX:MaxPermSize=128m
-Xverify:none applicare.jvmparams.param1=-XX\:+UseParallelGC
-XX\:MaxGCPauseMillis\=3 -Xms512m -Xmx512m -XX:CompileThreshold=8000
-XX:PermSize=48m  -XX:MaxPermSize=128m  -Xverify:none
You can also configure the amount of CPU you want to utilize during the capacity determination tuning runs. It is often the case that you are sharing the same box between multiple managed servers, so would naturally want to limit the hardware footprint of each process under load. Limits on acceptable queue length, number of waiters and other configurable options give you the ability to conform the tool to your environment's unique tuning needs.
Conclusion
The process of tuning WebLogic remains the same—except the tedious work of running loads, analyzing performance, making appropriate changes and restarting the WebLogic server are all seamlessly automated. Tune Wizard serves as a time-saving tool for automating load generation and performance tuning.
I have covered the automated JVM Tuning features in this article, but Applicare also automates configuration analysis, problem detection, root-cause detection, and a host of other features geared towards improving performance and availability.
References
- BEA's JVM Tuning Guide - a good place to start for JRockit and HotSpot tuning considerations
- EJB Tuning - WebLogic Server EJB tuning guide
- Tune Wizard - more information on Arcturus' Tune Wizard
- Request a Demo - you can request a demo of Applicare and try it out
Carl Brahms is a senior engineer with Arcturus Technologies Inc.