New Features and Tools in JRockit 5.0
by Eva Andreasson
02/22/2005
Abstract
This article describes the new features and tools in BEA JRockit 5.0. JRockit 5.0 includes J2SE compatibility, JVMTI, lock and thread improvements, stability improvements, and the dynamic garbage collector, to name a few features. The new tools and the tool improvements also contain an extended java.lang.management API, improved JRockit Runtime Analyzer, the new tool jrcmd, and perfmon integration.
JRockit 5.0 is free to use in development and production. You can download it from dev2dev. For support licenses, contact your BEA sales representative.
Release Schedule
Table 1 displays the release schedule for the most recent releases and the upcoming service pack for JRockit 5.0. The release discussed in this article is the standalone major release JRockit 5.0, called 1.5.0 in Figure 1.
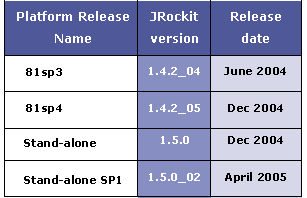
Figure 1. Release schedule for JRockit
Supported Platforms
JRockit is supported on numerous platforms. For example, the 32-bit version of JRockit 5.0 is fully supported on Microsoft Windows 2000, Microsoft Windows Server 2003, Red Hat Enterprise Linux 3.0 AS & ES (selected editions), and SuSE Linux Enterprise Server 9.0. The 64-bit version is fully supported on, for example, Microsoft Windows Server 2003 EE, Red Hat Enterprise Linux 3.0 AS & ES (selected editions), and SuSE Linux Enterprise Server 9.0.
On the Linux side, the major news is that we already have a tech preview of the 64-bit JVM for 64-bit OS on EM64T on SuSE Linux 9.0. In the standalone release of Service Pack 1, JRockit will be fully supported on Red Hat Enterprise Linux 4.0 and SuSE 9.0.
You can download the tech preview version from the JRockit web site.
View the documentation for complete information on platform support.
Themes for JRockit 5.0
JRockit development has always adhered to a number of development themes. JRockit 5.0 is no different, and this time we've expanded on them slightly:
- Performance - We have added stability to this theme. The performance and stability theme is defined as the ability to operate at the best possible performance for a given hardware and operating system and to rely on the stability of the JVM.
- Simplicity - We have added efficiency to this theme. The simplicity and efficiency theme is defined as the ability to quickly start up and run Java applications without having to configure and tune the JVM.
- Productivity and manageability - This theme was defined as the ability to quickly develop and run Java applications with greater insight and flexibility through the help of monitoring, analyzing, and manageability tools and features of the JVM.
The rest of this article shows how JRockit 5.0 delivers on these themes.
Performance and Stability
A number of performance and stability enhancements have been made. The following sections provide a brief overview of these enhancements.
Improved Performance on Linux
On the Linux platforms (see Figure 1) we gained a 5- to 10-percent performance improvement compared to the 1.4.2 SP3 release.
Figure 2 shows the relative performance for JRockit 5.0 compared to our most previous major release on SPECjbb2000. The default configuration of JRockit has been used for both the SuSE 9.0 and the RHAS 3.0 platforms.

Figure 2. JRockit 5.0 compared to our previous major release on SPECjbb2000
Further performance improvements will be available in JRockit 5.0 SP1.
More Effective Reference Handling
More effective reference handling has been implemented in JRockit 5.0, leading to better stability and increased reference handling performance. The following improvements have been made:
- Soft references pointing to the same object are either all cleared or all kept.
- Phantom references pointing to the same object become pending at the same time.
- Soft references are now cleared depending on how much memory is free after a garbage collection. Previously, it depended on the number of garbage collections that they survived.
- Objects with modified finalizers are now handled in an improved way, hopefully removing some of the most common issues depending on finalizers.
- Reference objects are internally linked in the heap; therefore, less native memory is spent on references.
Clearly Defined Out-of-Memory Situations
The way JRockit handles out-of-memory (OOM) situations is now clearly defined and documented. The documentation contains detailed explanations and motivations on how JRockit throws OOM exceptions and what actions are taken when the system is near an OOM situation. In short, JRockit can and should throw OOM exceptions when the application tries to allocate an object and the heap is full and cannot grow any larger.
The heap is considered full when all of these conditions are met:
- No softly referenced objects exist on the heap.
- The heap is fully compacted.
- The largest chunk of free memory that can be found on the heap after a garbage collection is smaller than the object that is to be allocated.
The heap cannot be increased when either of these conditions is true:
- The maximum heap size (
-Xmx) has been explicitly set and the heap size has reached-Xmx. - The heap size has been locked via the Management API.
- The maximum heap size (
-Xmx) has not been explicitly set and increasing the heap might lead to paging.
Parallel Young Space Collection
All CPUs on the host computer are now used during a garbage collection of the young space, in the same way as a parallel old collection is performed. Using all available CPUs will lead to shorter pause times for the young space collections, due to more efficient garbage collection.
Thread Stability Improvements
The behavior when starting and finishing a thread has been implemented to more closely resemble HotSpot's behavior. For example, Thread.isAlive() and the Thread State Values now return the same values as HotSpot does, in all situations. This was not the case in our previous releases.
More thread profiling information is now also available through the java.lang.Thread API, through the new JVMTI interface, and through the Management Console.
Lock Improvements
Major internal rewritings have contributed to sorting out several potential deadlocks and a reduced number of race conditions, and have made it possible to provide JVMTI support.
With the introduction of JVMTI, new and improved profiling information is now available. The lock profiling information is available through the JRA and the ctrl-break handler.
Fat locks now use adaptive spinning before going to sleep; that is, the amount of spinning before going to sleep is adaptively tuned during runtime.
Fat lock deflation is now enabled. After a certain number of non-contending locks, fat locks can now deflate to thin locks.
Overall Stability Improvements
Many of the stability improvements come from major code refactoring and improved test routines and test environments. This has led to a number of stability improvements to JRockit, including:
- Better handling of low-on-memory situations
- Better maintainable and generalized code
- Better code abstractions
Simplicity and Efficiency
This section examines the ability to quickly start up and run Java applications without having to configure and tune the JVM.
J2SE 5.0 Compatibility
JRockit 5.0 is J2SE 5.0-compatible.
Dynamic Garbage Collector
In JRockit 5.0 the dynamic garbage collector is the default when starting JRockit (in server mode). This means that JRockit will switch between different garbage collector modes depending on the application's behavior and needs.
Apart from the change in the algorithm behind the scene, the major change is that the nursery size ( -Xns) is now dynamically set by the dynamic collector, that is, if no -Xns is specified, the dynamic garbage collector will tune the nursery size automatically. The startup option -Xns overrides the ability to change the nursery size adaptively.
The dynamic garbage collector tries to optimize for maximal throughput. If you want to optimize for short pauses, you can use the -Xgcprio:pausetime option.
New Startup Option: -XpauseTarget
If you know how the maximum length of garbage collection pauses your application can accept, you can specify a pause target with the new startup option -XpauseTarget. JRockit will try to maximize throughput but keep garbage collection pauses within the bounds of the specified target. Note that this target is a "soft goal," which means that JRockit will make the best effort to keep all pause times close to the target.
For example, if you believe your application will handle the pressure of a 200ms pause time limitation, you can specify the option on the startup command line in the following way:
java -XpauseTarget=200ms MyApplication
Dynamic Compaction
Through the new compaction heuristics in JRockit 5.0, JRockit has achieved a more even pause time behavior. The improvement also leads to freeing larger chunks of memory for less work, meaning your Java application will be interrupted less.
Productivity and Manageability
The final set of improvements falls under productivity and management. JRockit has always had a great set of tools for monitoring and tuning the JVM. The following sections show how these have been extended.
JMX
The Management Console is now a JMX client, that is, the Management Console communicates with the management server using the JMX standard. The management server, or the JMX agent, is started in the same way as before, by setting the startup option -Xmanagement on the command line.
For instructions on how to use the Management Console, see the Management Console documentation.
Extended java.lang.management
We have extended the java.lang.management API by creating JRockit-specific MXBean interfaces. All you have to do is implement any of these interfaces and you will have access to profiling data through information channels directly connected to JRockit:
JRockitConsoleMXBeanincludes, among other things, methods for changing garbage collection strategy during runtime. You can also invoke the ctrl-break handler or make a JRA recording.MethodProfilerMXBeanincludes methods for turning on method profiling and for enabling exception counting.ThreadMXBeanmakes it possible to get a thread stack dump.
These provide you with a much finer control over the JVM.
JVMTI
JVMTI, the tool interface available in JRockit 5.0, is an integration of the previous debugging interface JVMDI and profiling interface JVMPI. The implementation of JVMTI delivers more profiling data and provides a much clearer interface. Apart from the benefit of enabling JVMTI, we have also succeeded in making the code for the debug/profiling interfaces less intrusive.
New Data Persistence Handling
The Management Console now contains a new profiling data persistence handling system. The collected data is now saved in a comma-separated text file, not in a binary file as before. This helps you to more easily analyze the collected data using a variety of tools, including a spreadsheet.
JRockit Runtime Analyzer Improvements
The JRockit Runtime Analyzer (JRA) now enables a choice between garbage collection recordings, call-trace sampling, or both. The look-and-feel has been updated as shown in Figure 2. Overall GUI-improvements have also been included that contain changes to provide clearer information about how many samples and call-traces have been performed.
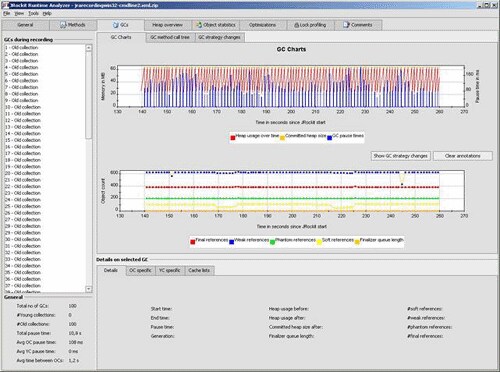
Figure 3. JRA screenshot of the garbage collection chart
To start a recording you can use the recording option under the plug-in menu of the Management Console, available in developer mode. You can also use command-line options. To start the JRockit Runtime Analyzer to view a recording, you may use the following command line:
java -jar RuntimeAnalyzer.jar
For detailed explanations on usage, view the JRA-specific documentation. The JRockit Runtime Analyzer is free to use in development and production. You can download the GUI from dev2dev.
perfmon Integration
The Microsoft Windows platform monitoring tool, perfmon, has been integrated with JRockit. JRockit now provides profiling data that can be displayed in perfmon (see Figure 3), which is valuable if you want to monitor other processes running concurrently with JRockit.
A monitoring tool only available on the Windows platforms, perfmon is a part of the platform, so you can easily run it from any command window just by typing perfmon.
Figure 4 shows a screenshot of perfmon when observing the processor counter "% User Time" and the JRockit-specific performance counters "Heap Size" and "Used Heap After GC". As is evident in this case, the application has an increasing memory usage, forcing the heap to grow continuously, which affects the percentage of user time on the processor.

Figure 4. Perfmon screenshot
Before using the tool with JRockit you must install the JRockit-specific performance counters. An installation program is shipped with JRockit and may be found in your JDK. No usage documentation is currently available.
New Tool: jrcmd
A new tool called jrcmd has been developed for JRockit 5.0. This tool makes it possible to send commands to a running JRockit instance without having to restart the JRockit process. You don’t even have to specify any particular startup options to use this tool. For example, you can start a JRA recording or extract heap information during runtime.
You can find the tool in your JDK installation. To find out more about the tool, use the help option ( jrcmd -h).
Summary
This article presents an overview of the new features and tool improvements in JRockit 5.0. Based on the development guideline themes for JRockit, in the JRockit 5.0 release we have provided a host of features, many of them described here.
JRockit 5.0 is our most stable release so far, and we are convinced that you will notice the difference and the increased value of the new features and tools. Experiment with the various sets of tools that JRockit provides for monitoring or analyzing your Java application. The tools will help you find the weak spots and improve your application’s performance. Be sure to provide feedback and ideas for further improvements. You can use our newsgroups for feedback.
Resources
Eva Andreasson received an M.Sc. degree from the Royal Institute of Technology, Stockholm, Sweden in 2002 with a major of Autonomic Systems. Ever since, she has been a part of the development team of JRockit at BEA Systems. Her main focus include the dynamic garbage collector and her plans for the future contain developing a distributed garbage collectior for SSI systems.