 - on the bottom left of the screen to filter the events.
The Event Log provides a complete history of all jobs and tasks that have run on an OEDQ server.
By default, the most recent completed events of all types are shown in the log. However, you can filter the events using a number of criteria to display the events that you want to see. It is also possible to tailor the Event Log by changing the columns that are displayed in the top-level view. Double-clicking on an event will display further information where it is available.
The displayed view of events by any column can be sorted as required. However, older events are not displayed by default, so a filter must be applied before sorting before they can be viewed.
An event is added to the Event Log whenever a Job, Task, or System Task either starts or finishes.
Tasks are run either as part of Jobs or individually instigated using the Director UI.
The following types of Task are logged:
The following types of System Task are logged:
If the Director UI is connected to multiple servers, you can switch servers using the Server drop-down field in the top-left hand corner.
Quick filter options are made available to filter by Event
Type, Status and Task Type. Simply select the values
that you wish to include in the filter (using Control - Select to select
multiple items) and click on the Run Filter button - - on the bottom left of the screen to filter the events.
For example:

Further free-text filtering options are available to filter by Project Name, Job Name, Task Name and User Name. These are free-text so that you can enter partial names into the fields. You can enter a partial name into any of these fields - provided the object contains the partial name, it will be displayed (though note that matching is case-sensitive). For example, if you use a naming convention where all projects working on live systems have a name including the word 'Live' you can display all events for live systems as follows:

|
Note:The Project Name column is not displayed by default. To change the view to see it, click on the Select Columns button on the left hand side, and check the Project Name box. |
The final set of filters, on the right-hand side of the screen, allow you to filter the list of events by date and time. A Date picker is provided to make it easier to specify a given date. Note that although only the most recent events are shown when accessing the Event Log, it is possible to apply filters to view older events if required.
|
Note:Events are never deleted from the history by OEDQ, though they are stored in the repository and may be subject to any custom database-level archival or deletion policies that have been configured on the repository database. |
Events may be filtered by their start times and/or by their end times. For example, to see all Jobs and Tasks (but not System Tasks) that completed in the month of November 2008, apply filters as follows:

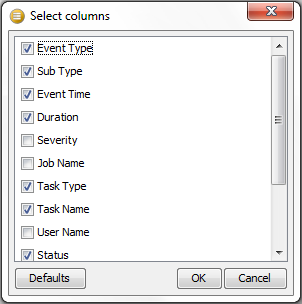
To change the set of columns that are displayed on the Event Log, click the Select Columns button on the top left of the Event Log area. The Select Columns dialog is displayed. Select or deselect the columns as required, and click OK or save or Cancel to abandon the changes. Alternatively, click Default to restore the default settings:

Note that Severity is a rarely used column - it is currently set to 50 for tasks or jobs that completed correctly, and 100 for tasks or jobs that raised an error or a warning.
Double-clicking to open an event will reveal further detail where it is available.
Opening a Task will display the Task Log, showing any messages that were generated as the task ran:

|
Note: Messages are classified as INFO, WARNING, or SEVERE. An INFO message is for information purposes and does not indicate a problem. A WARNING message is generated to indicate that there could be an issue with the process configuration (or data), but this will not cause the task to error. SEVERE messages are generated for errors in the task. |
For Jobs, if a notification email was configured on the job, the notification email will be displayed in a web browser when opening the completed event for the Job. Jobs with no notifications set up hold no further information.
It is possible to export the viewable data in the Event Log to a CSV file. This may be useful if you are in contact with Oracle Support and they require details of what has run on the server.
To export the current view of events, click Export to CSV. This will launch a browser on the client for where to write the CSV file. Give the file a name and click Export to write the file.
Oracle ® Enterprise Data Quality Help version 9.0
Copyright ©
2006,2011 Oracle and/or its affiliates. All rights reserved.