Before You Begin
Purpose
Oracle Big Data Spatial and Graph comprises several features and technologies.This tutorial covers the use of the Property Graph feature to inspect graph properties, query property graph data, and visualize property graph data. You will learn how to:
- Leverage Oracle NoSQL Database and Apache HBase
- Perform the following property graph actifvities:
- Find influencers in a social graph
- Detect connectivity in the graph
- Identify communities within the graph
- Use Apache SolrCloud to query graph properties
- Optionally, use Cytoscape to visualize graph data
Time to Complete
Approximately 45 mins
Background
Oracle Big Data Spatial and Graph contains three key components:
- A distributed property graph database with over 35 in-memory parallel graph analytics
- A wide range of spatial analysis functions and services
- A multimedia framework for distributed processing of video and image data in Apache Hadoop
What Do You Need?
Have access to Oracle Big Data Lite Virtual Machine (VM), version 4.8 or higher. This VM includes Oracle NoSQL and Apache HBase, which are used in this tutorial.
Start Oracle NoSQL Database
This property graph tutorial uses Oracle NoSQL Database to perform it's tasks. In this topic, you start Oracle NoSQL Database and ensure that it is running.
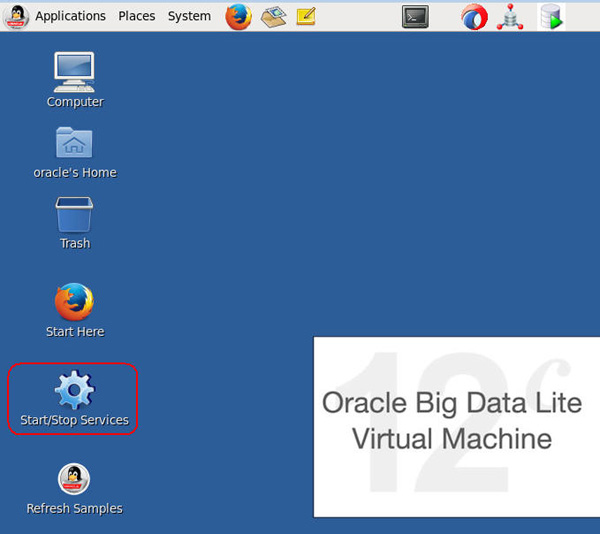
To begin, start the Big Data Lite VM, and then locate the Start/Stop Services icon on the Desktop, as shown here:
Then, perform the following steps:
-
Double-click the Start/Stop Services icon to open a terminal window that shows a list of Oracle Big Data Lite Services:

Description of this image -
Use the down arrow key to find and select the NoSQL option. Then, press the Spacebar to select the option, as shown here:

Description of this image -
Press the Enter key to start Oracle NoSQL Database Database. After NoSQL starts up, the terminal window automatically closes.
Perform Property Graph Activities
The exercises in this tutorial use the social graph example show here.
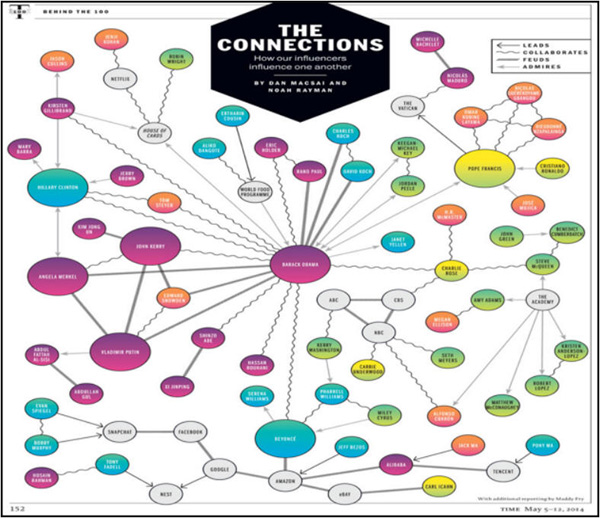
This small social graph contains well-known people and companies, and there are four distinct relationships found in the graph: leads, collaborates, feuds, and admires.
Using this sample graph, you will learn how to perform several common property graph activities, including finding influencers, detecting connectivity, identifying communities (or clusters), querying propery graph data, and visualizing propery graph data.
The exercises in the following topics are designed to be performed in order.
Find Influencers in the Graph
In this topic, you apply property graph features using the Apache Groovy interface to find influencers in the graph. This process uses a combination of technologies, and includes several steps:
- First, you start up Groovy.
- Second, you get an instance of OraclePropertyGraph.
- Third, you load the graph data (in parallel) into the database and read all of the verticies.
- Fourth, you get an In-Memory Analyst to read the graph from the database into memory.
- Finally, you run Page Rank analytics on the graph data to find influencers.
Notes:
- Apache Groovy is a powerful language with static-typing and static compilation capabilities. In this exercise, Groovy serves as an interactive SHELL/Script environment.
- Page Rank is a link analysis algorithm used in the World Wide Web. It assigns a numerical weighting to each element of a hyperlinked set of elements, with the purpose of "measuring" its relative importance within the set.
Page Rank is used to find the number and quality of edges that are pointing to a graph element to determine its importance. A Page Rank value (PR) tends to be higher when there are many links from other elements, or links from important elements to it, as shown in the example here:
Follow these steps to find influencers in the graph.
-
Open a Terminal window by clicking the Terminal icon in the taskbar, as shown here:

Description of this image -
Using the terminal window, start Groovy by executing the following two lines of code:
cd /opt/oracle/oracle-spatial-graph/property_graph/dal/groovy/
sh gremlin-opg-nosql.sh
Result: The Groovy command line environment is launched, as shown here:

Description of this image -
To begin, use the code segment supplied below get an instance of OraclePropertyGraph.
Hints for Using Code Segments:
- Executable code is shown in Bold.
- Text that follows double forward slashes (
//) are non-executable comments. - Code lines that end with a single back slash (
\) indicate a continuation of the code. These lines should be executed all together as one unit. - To execute code, individually copy/paste code lines from the provided code segments into the Groovy interface. Then, execute each line of code at the Groovy command line by pressing
Enter.
// Provide Oracle NoSQL Database server name and port server = new ArrayList(); server.add("bigdatalite:5000"); // Create a graph config that contains the graph name "connections" // KV store name "kvstore", edge property "weight" to be loaded into // in-memory graph, etc. cfg = GraphConfigBuilder.forPropertyGraphNosql() \ .setName("connections").setStoreName("kvstore") \ .setHosts(server) \ .addEdgeProperty("weight", PropertyType.DOUBLE, "1000000") \ .setMaxNumConnections(2).build(); // Get an instance of OraclePropertyGraph which is a key Java // class to manage property graph data opg = OraclePropertyGraph.getInstance(cfg); // Set the Degree of Parallelism (DOP) for clearing graph data // from the existing OraclePropertyGraph instance opg.setClearTableDOP(2); // will return NULL because this // API has no return value. // It is expected. opg.clearRepository(); // remove all vertices and edges -
Now, load the "Connections" Graph data into Oracle NoSQL Database by executing the following lines of code:
// OraclePropertyGraphDataLoader is a key Java class used to // bulk load property graph data into backend databases. opgdl=OraclePropertyGraphDataLoader.getInstance(); vfile="../../data/connections.opv" // Identifies vertex flat file efile="../../data/connections.ope" // Identifies edge flat file // Set Degree of Parallelism (DOP) to 2 in order to load property graph data files // into the database in parallel. opgdl.loadData(opg, vfile, efile, 2); // export this property graph out in JSON format OraclePropertyGraphUtils.exportGraphSON(opg, "/u02/connections.graphson", System.out) -
Then, execute the following line of code to read in all the vertices.
opg.getVertices();The expected output of the
getVertices()function call is a list of vertices in serialized format. Some of the output of this function call is shown below. Note: The Vertex ID order in your output may differ.
Description of this image -
Next, execute the following code segments to: (A) Create an in-memory session and analyst , (B) Read the graph from the database into memory, and (C) Create a helper function for printing.
// Create in-memory Session session=Pgx.createSession("session_ID_1"); // Press Enter after the "Bind an actual implementation of IEditorRegistry..." message // Create an Analyst from the in-memory Session analyst=session.createAnalyst(); // Read the graph from database into memory pgxGraph = session.readGraphWithProperties(opg.getConfig()); // create a helper function for printing def p(v) { s1=v.getProperty("name"); \ if (s1.length() > 30) return s1; \ s=s1; \ for (int idx = 0; idx < 30 - s1.length(); idx++) \ { s=s+ " ";}; \ return ("vertex " + s + " id " + v.getId()); \ } -
Finally, use the following code segments to execute Page Rank on the data and find the highest three influencers in the graph.
// Execute Page Rank
rank=analyst.pagerank(pgxGraph, 0.00000001, 0.85, 5000);

// Get 3 vertices with highest PR values
it = rank.getTopKValues(3).iterator();     \
while(it.hasNext()) {                      \
  v=it.next();                             \
  id=v.getKey().getId();                   \
  pr=v.getValue();                         \
  System.out.println("Influencers --->" +  \
    p(opg.getVertex(id)) + " pr= " + pr);  \
}
The expected output is shown in the hightlighted portion of this screen shot:

Description of this image
Detect Connectivity in the Graph
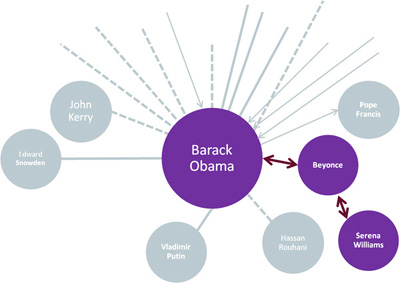
Now that we have generated a list of the influencers in the graph, we want to discover conectivity values in the graph. A shorter path between elements indicates a greater the value of that connection, as illustrated here:
Two algorithms are used in this exercise to detect this information: Dijkstra and Bellman-Ford.
- For Dijkstra, we adopt an optimized version called Bi-directional Dijkstra which usually outperforms the original, single-directional Dijkstra. Dijkstra is used to find a shortest path between two given vertices.
- Bellman-Ford, on the other hand, finds all shortest paths from a single starting point.
To run shortest path analysis in a property graph, edges in that graph need to have a "weight" property or a numeric value-based property that can be used to denote an edge weight. To complete this analysis, you will perform the following activities:
- Load a .graphson (JSON) format property graph into Oracle NoSQL Database.
- Read in all the edges of the graph.
- Create an Apache Lucene based text index for fast lookup of graph elements.
- Use a text search to find starting and destination vertices.
- Run shortest path analysis with Dijkstra.
- Run shortest path analysis with Bellman-Ford.
Using the same terminal window from the previous topic, follow these steps to detect connectivity in the graph.
-
First, use the following code segement to get an Instance of OraclePropertyGraph and then load the graph data into Oracle NoSQL Database:
Note: Recall that the
serverobject for the NoSQL database was created in the last topic.// Create graph config with graph name, KV store name, edge property, etc. cfg = GraphConfigBuilder.forPropertyGraphNosql() \ .setName("connections").setStoreName("kvstore") \ .setHosts(server) \ .addEdgeProperty("weight", PropertyType.DOUBLE, "1000000") \ .setMaxNumConnections(2).build(); // Get an instance of OraclePropertyGraph opg = OraclePropertyGraph.getInstance(cfg); // Set the DOP for clearing graph data from the existing instance opg.setClearTableDOP(2); opg.clearRepository(); // Load the GraphSON format property graph data OraclePropertyGraphUtils.importGraphSON(opg, "/u02/connections.graphson", System.out); -
Now, execute the following line of code to read in all the edges.
opg.getEdges();The expected output of the the
getEdges()function call is a list of edges in serialized format. Some of the output is shown below:
Description of this image Notes:
- In the output, each graph element is referenced by a Vertex ID. Each Edge ID indicates a connection between two graph elements (two Vertex IDs). All graph elements have at least one associated Edge, or connection.
- As highlighted in the output, some graph elements contain two or more connections. For example:
- At the top of the terminal window, Vertex ID 57 (Dieudonne Nzapalainga) has one connection (Edge 1123) to Vertex ID 5 (Pope Francis), and another connection (Edge 1124) to Vertex ID 58 (Nicolas Guerekoyame Gbangou).
- At the bottom of the terminal window, Vertex ID 67 (Google) has one connection (Edge 1152) to Vertex ID 37 (Amazon), and another connection (Edge 1154) to Vertex ID 73 (Nest).
-
Next, run the following code segments to create the Lucene based text index:
// Configure index parameters for Lucene indexParams = OracleIndexParameters.buildFS(1, 4, 10000, \ 50000, true, "/u02/lucene-index"); // Set the index parameters into the OraclePropertyGraph instance opg.setDefaultIndexParameters(indexParams); // Prepare the text index for 4 property names indexedKeys = new String[4]; indexedKeys[0] = "name"; indexedKeys[1] = "role"; indexedKeys[2] = "religion"; indexedKeys[3] = "country"; // Create auto indexing on above properties for all vertices opg.createKeyIndex(indexedKeys, Vertex.class); -
Now run the following code segments to find the starting and destination vertices.
// Find the starting vertex with a text query. // Pick the first one out of the matches as there could be multiple matches. vStart = opg.getVertices("name", "*Obama*", true) \ .iterator().next(); // Then find the destination vertex with a text query vEnd = opg.getVertices("name", "Serena*", true) \ .iterator().next(); // Create the same print helper function as before def p(v) { s1=v.getProperty("name"); \ if (s1.length() > 30) return s1; \ s=s1; \ for (int idx = 0; idx < 30 - s1.length(); idx++) \ { s=s+ " ";}; \ return ("vertex " + s + " id " + v.getId()); \ } -
Compute shortest path analysis with Dijkstra by running the following code segments.
//Get in-memory instance, create session, create analyst
instance = Pgx.getInstance();
session = instance.createSession("session_ID_1");
analyst = session.createAnalyst();

// Read the graph from database into memory using Dijkstra
pgxGraph = session.readGraphWithProperties(opg.getConfig());
weight = pgxGraph.getEdgeProperty("weight");
path = analyst.shortestPathDijkstra(pgxGraph, vStart.getId(), vEnd.getId(), weight);

// Are these two vertices connected? (should return true)
path.exists();

// What is the weight of the path? (should return 2.0)
path.getPathLengthWithCost();

// Print out all vertices on the shortest path
it=path.getVertices().iterator();           \
while(it.hasNext()) {                       \
v=it.next();                                \
id=v.getId();                               \
System.out.println("Shortest path --->"+    \
  p(opg.getVertex(id)));                    \
}
The expected output is shown in the hightlighted portion of this screen shot:

Description of this image -
Use the following code segments to compute shortest path analysis with Bellman-Ford.
// Read the graph from database into memory using Bellman-Ford
weight = pgxGraph.getEdgeProperty("weight");
allPaths=analyst.shortestPathBellmanFord(pgxGraph, vStart.getId(), weight);

// Get the shortest path that ends with Alibaba
vEnd = opg.getVertices("name", "Alibab*", true).iterator().next();
path = allPaths.getPath(pgxGraph.getVertex(vEnd.getId()))

// Are these two vertices connected? (should return true)
path.exists();

// What is the weight of the path? (should return 2001.0)
path.getPathLengthWithCost();

// Print out all vertices on the shortest path
it=path.getVertices().iterator();           \
while(it.hasNext()) {                       \
v=it.next();                                \
id=v.getId();                               \
System.out.println("Shortest path --->"+    \
  p(opg.getVertex(id)));                    \
}
The expected output is shown in the hightlighted portion of this screen shot:

Description of this image -
Close the Terminal window. (Choose Close Terminal in the warning dialog.)
Identify Communities Within the Graph
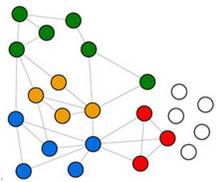
Finding Communities (or Clusters) in a social graph can be illuminating and profitable. Individual elements within a community tend to share a set of common characteristics or exhibit one or multiple common behaviors.
This idea is illustrated in the graph example here.
This topic explores three community detection concepts and techniques, which are defined here:
- Weakly Connected Components (WCC).
- A graph is connected when there is a path between every pair of vertices. In a connected graph, there are no unreachable vertices.
- A directed graph comprises a set of vertices that are connected by edges, where the edges have a direction associated with them. For example, two of the three edges in this graph have one direction, while the third edge is bidirectional:

Description of this image - A directed graph is considered weakly connected if all of its directed edges are replaced with undirected edges, as shown here:

Description of this image
- Sparsification.
- Sparsification occurs in a graph when you remove edges in a way that increases the number of clusters.
- The sparsification technique adopted by Oracle Big Data Spatial and Graph looks at all edges of every single vertex in a localized fashion, and removes those edges that are more likely to increase the number of clusters, as shown here:

Description of this image
- Label propagation. The algorithm
used by Oracle's property graph feature:
- Initializes every vertex with a unique label
- Updates a vertex's label and at every subsequent step with one label that is shared by most of its neighbors
In this exercise, you will perform the following activities:
- Start Apache HBase, Zookeeper, and HDFS.
- Load a property graph into Apache HBase using parallelism.
- Add a two-vertices loop using theTinkerpop Blueprints Java API.
- Instantiate an in-memory anayst instance, and establish a session.
- Read a graph into memory from Oracle NoSQL Database.
- Run the previously discussed Community (Cluster) detection analytics.
To identify communities within the graph, follow these steps:
-
Double-click the Start/Stop Services icon to open a terminal window that shows a list of Oracle Big Data Lite Services:
- Perform the following:
- Use the down arrow key to select the HBase option. Then, press the Spacebar to enable the option.
- Note: the Zookeeper and HDFS options should be on by default. If not, use the Spacebar to enable them.
The list should look like this:

Description of this image -
Press the Enter key to start the selected service(s). The Terminal window will close automatically when the service(s) are started.
-
As you did previously, open a Terminal window by clicking the Terminal icon in the taskbar.
-
Using the terminal window, start Groovy by executing the following two lines of code:
cd ////opt/oracle/oracle-spatial-graph/property_graph/dal/groovy/
sh gremlin-opg-hbase.sh
Result: The Groovy command line environment for HBase is launched, as shown here:

Description of this image -
At the Groovy command line, use the following code segement to set up the required connections, get an Instance of OraclePropertyGraph, and then load the graph data into Apache HBase.
// Get a graph config that has graph name "connections" and // Zookeeper host, port, and some other parameters cfg = GraphConfigBuilder.forPropertyGraphHbase() \ .setName("connections") \ .setZkQuorum("bigdatalite").setZkClientPort(2181) \ .setZkSessionTimeout(120000).setInitialEdgeNumRegions(3) \ .setInitialVertexNumRegions(3).setSplitsPerRegion(1) \ .addEdgeProperty("weight", PropertyType.DOUBLE, "1000000") \ .build(); // Get an instance of OraclePropertyGraph which is a key Java class // to manage property graph data opg = OraclePropertyGraph.getInstance(cfg); opg.clearRepository(); // Use OraclePropertyGraphDataLoader to bulk load property graph data // into the backend databases. opgdl=OraclePropertyGraphDataLoader.getInstance(); vfile="../../data/connections.opv" efile="../../data/connections.ope" opgdl.loadData(opg, vfile, efile, 2); -
Next, execute the following code segments to add a loop of just two vertices, vx and vy. Then, add a bidirectional connection -- one edge from vx to vy, and another from vy to vx.
// Add a loop of just two vertices, vx and vy, using Blueprints Java API vx = opg.addVertex(1234l); vy = opg.addVertex(1235l); // Then, add an edge from vx to vy, and another from vy to vx e1=opg.addEdge(3000l, vx, vy, "likes"); e1.setProperty("weight", 1.1d); e2=opg.addEdge(3001l, vy, vx, "likes"); e2.setProperty("weight", 1.5d); opg.commit(); -
As you've done previously, run the following code segments to create an in-memory analyst session, and read the graph data from Apache HBase into memory.
// Create an in-memory session session=Pgx.createSession("session_ID_1"); // Press Enter after the "Bind an actual implementation of IEditorRegistry..." message // Create an Analyst from the in-memory Session analyst=session.createAnalyst(); // Read graph data from database into memory pgxGraph = session.readGraphWithProperties(opg.getConfig()); -
Now, run the following code segments to perform community detection analytics.
// Run the WCC algorithm
partition = analyst.wcc(pgxGraph)
partition.size() // should be 2
// Get the first community (collection of vertices) - See Output Below
vertexCollection = partition.getPartitionByIndex(0);

// Run Label Propagation
partition = analyst.communitiesLabelPropagation(pgxGraph)
// How many communities do we have?
partition.size() // should be 18
// Get the first community by ID - See Output Below
vertexCollection = partition.getPartitionByIndex(0);
The example output from from these analytics is shown next:

Description of this image 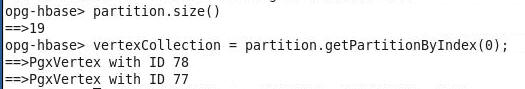
Description of this image -
Now that we have the communities detected, run the following code to look into a community that has an entity of interest (in this example, the cluster that has the vertext "Alibaba").
// Look into the community that has the vertex Alibaba
v = opg.getVertices("name", "Alibaba").iterator().next();
vertexCollection = partition.getPartitionByVertex(pgxGraph.getVertex(v.getId()));
// Get the details of 4 vertices within this community.
// "l" below indicates a Long integer
opg.getVertex(69l);
opg.getVertex(68l);
opg.getVertex(65l);
opg.getVertex(71l);
The expected output of the previous step is shown is shown below:

Description of this image -
Close the Terminal window. (Choose Close Terminal in the warning dialog.)
Query Property Graph Data Using Apache SolrCloud
This virtual machine includes a property graph data set stored in both Oracle NoSQL Database and Apache HBase. It is pre-configured with a text index for several vertex attributes. The text index itself is stored in SolrCloud.
In this exercise, you use the property graph data and text index to perform the following:
- Enable services for Apache SolrCoud, HBase, Zookeeper, and HDFS
- Leverage a SolrCloud core index for all of the vertices of the preconfigured property graph
- Query the graph properties using Solr's web interface.
Follow these steps:
-
Double-click the Start/Stop Services icon to open a terminal window that shows a list of Oracle Big Data Lite Services:
-
Ensure that the Zookeeper, HDFS, HBase, and Solr options are enabled. By default, Zookeeper, HDFS and HBase should be on, but Solr is off. Scroll down to view the Solr option. If it is off, use the Spacebar to select the option and then press the Enter key. The selected service will start and the terminal window will close automatically.
-
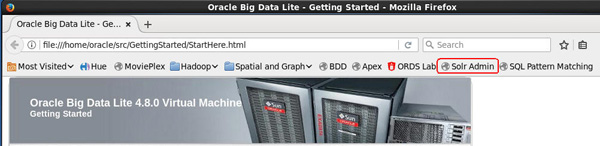
Next, double-click the the Start Here Firefox desktop icon to open the browser.
-
Click the Solr Admin tool below the address line, as shown here:
Description of this image Result: the Apache Solr Admin page appears:

Description of this image -
In the navigation pane, click on the Core Selector option, as shown below.
Result: A search box opens, and the first option in the list is automatically selected.

Description of this image -
Click on the first entry OSG_PG_AV_VERTEX
Result: a list of options appear below the selected Core.
-
Scroll down and click the Query option, as shown here:

Description of this image Result: A query interface appears next to the navigation pane.
-
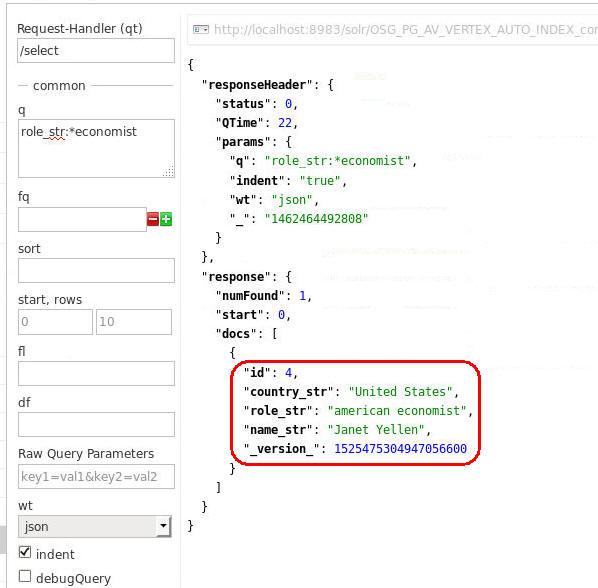
In the query interface, navigate to the first text box ("q") under the "---- common -----" heading. Then, replace the default contents with the string
role_str:*economist, as shown below:
Description of this image -
Then scroll to the bottom of the query interface and click the Execute Query button, as shown below:

Description of this image The results below show one match from this query. The match has a vertex id=4, which is defined in the property graph. This vertex has a few indexed properties including country="United States", role="american economist", and name="Janet Yellen".
Notes:
- The suffix "_str" in the "q" box denotes that the data type of the property value is String.
- Your "QTime", "_", and "_Version_" values may differ.
-
Description of this image -
Close the Browser.
Visualize Property Graph Data Using Cytoscape
In this optional exercise, you install open source Cytoscape on the VM. Then, you use Cytoscape to load graph data from Oracle NoSQL Database and visualize that data.
What Do You Need?
- Ensure that the Zookeeper, HDFS, HBase, and NoSQL options are enabled. If not, Start/Stop Servies to enable them as you have learned in previous topics..
- Download and install Cytoscape 3.5.1 on the Big Data Lite VM.
- Configure Oracle property graph visualization support for Cytoscape.
Download, Install, and Configure Cytoscape
To install and configure Cytoscape on the VM, follow these steps.
- First, download the Cytoscape installation file by performing the following:
- Open the browser and enable proxy access. To do this, select Edit > Preferences > Advanced > Network > Settings. Then select the Auto-detect proxy settings for this network option and click OK.
- Using the browser, go to the Big Data Spatial and Graph Downloads page at: http://www.oracle.com/technetwork/database/database-technologies/bigdata-spatialandgraph/downloads/index.html
- In the Download page, click the Download Cytoscape 3.x ...link.
- On the Download Cytoscape page, select Version 3.5.1 for Linux.
- In the Opening Cytoscape_3_5_1_unix.sh dialog window, choose the Save File option, and click OK.
- NOTE: When the download completes, the file is saved in the Downloads directory.
-
Open a Terminal window. Then, run the first two commands shown below to verify that the Cytoscape_3_5_1_unix.sh file download is complete. Then, run the final command to install the Cytoscape software.
cd Downloads
ls -l
sh Cytoscape_3_5_1_unix.sh
Result: An Installation wizard opens.
-
In the wizard: (A) Click Next; (B) Accept the General Public Licence agreement and click Next, (C) Accept the default installation destination of
/home/oracle/Cytoscape_v3.5.1) and click Next; (D) When the Setup Wizard completes, click Finish. - Next, download and unzip the oraclebigdataspatialgraph_v2_2_cytoscape.zip archive. This archive contains required Cytoscape support files for Oracle.
- In the browser, go back to: http://www.oracle.com/technetwork/database/database-technologies/bigdata-spatialandgraph/downloads/index.html
- Click the Download Oracle Big Data Spatial and Graph Software link.
- In the Downloads tab, accept the Licence Agreement, and click the Download Oracle Big Data Spatial and Graph 2.2 Support for Cytoscape link.
- After logging into Oracle, select the Save File option, and click OK.
- Once the download completes, close the browser,
-
In the terminal window and execute the following lines of code to unarchive the support files.
cd /home/oracle/cd Cytoscape_v3.5.1/ unzip ~/Downloads/oraclebigdataspatialgraph_v2_2_cytoscape.zipResult: The support files for Cytpscape are installed under the .../Cytoscape_v3.5.1/ directory.
-
Now, execute the following commands to install the support files and launch Cytoscape. This will enable you to perform the remaining configuration tasks.
cd /home/oracle/Cytoscape_v3.5.1/ unzip ~/Downloads/oraclebigdataspatialgraph_v2_2_cytoscape.zip ./cytoscape.shNotes: The first time you launch Cytoscape, the tool creates a
/CytoscapeConfiguration/directory under your user's home and creates the requiredpropertyGraphfiles. -
Close the Cytoscape welcome page and quit the application.
-
Then, use the Terminal window and copy two
propertyGraphfiles to the appropriate directories by executing the following commands:cd oraclebigdataspatialgraph_v2_2_cytoscape/jar cp propertyGraph.properties /home/oracle/CytoscapeConfiguration cp propertyGraphSupport.jar ~/CytoscapeConfiguration/3/apps/installed/ -
To complete the configuration, provide the required connection settings for Oracle NoSQL Database by performing the following:
A. In the main menubar, select Applications > Accessories > gedit Text Editor.
B. Open the
/home/oracle/CytoscapeConfiguration/propertyGraph.propertiesfile.C. Enter the following property values, as shown below:
- oracle-pg-port=5000
- oracle-pg-store-name=kvstore
- oracle-pg-graph-name=connections
- oracle-pg-host=bigdatalite.localdomain
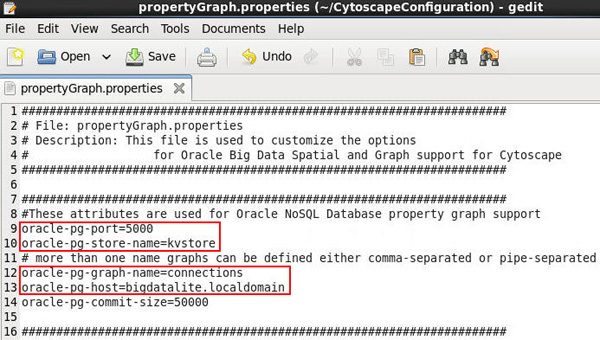
Description of this image D. Save your changes and then quit gedit.
Result: Cytoscape is now configured for Oracle NoSQL Database data visualization.
-
In the terminal window, execute the following commands to start the Tomcat PGX server:
cd /opt/oracle/oracle-spatial-graph/property_graph/pgx/bin/
./start-server
Use Cytoscape for Data Visualization
Follow these steps:
-
Open a new terminal window and execute the following commands to launch Cytoscape:
cd /home/oracle/Cytoscape_v3.5.1/ sh ./startCytoscape.sh -
Close the Cytoscape Welcome window.
-
Using the Cytoscape menu bar, select File > Load > Property graph > Connect to Oracle NoSQL Database, as shown here:

Description of this image Result: The Load from Oracle NoSQL Database dialog appears.
-
In the Load from Oracle NoSQL Database dialog, specify the vertices for the visualization process. In the Start from nodes tab, enter 10 in the Top Ranked box, as shown below:
Notes: By default, the importance is measured by the page rank of the vertices, as shown in the In-memory Analytics Starting Point radio button list. Also, notice the values for Host, Port, Graph name, and Store name, which are read from the properties file.

Description of this image -
Then, click on the Load graph button, as shown above.
Result: A new window opens. The top 10 page rank value verticies are displayed in a Property graph pane. In addition, associated node information is displayed in the Table Panel pane.
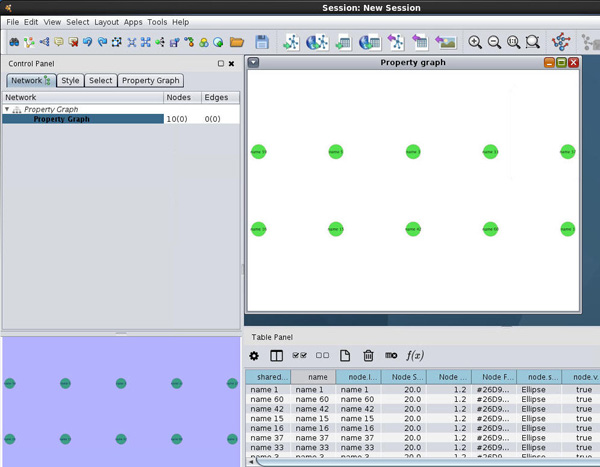
Description of this image - Close the Table Panel pane, and then click in the Property graph pane. Then select all 10 nodes by pressing Ctrl+A
Result: The nodes turn yellow in color, as shown below:

Description of this image -
To include additional vertices that are connected to the Top 10 group, press "e" on your keyboard.
Result: All of the adjacent vertices and edges of the Top 10 vertices are read from the property graph and placed into the graph with appropriate connections. Your display should now look similar to the graph shown here:
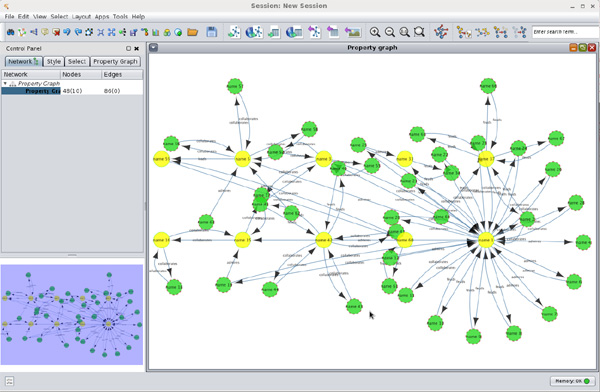
Description of this image Next, choose a layout that highlights the graph clusters.
-
Using the toolbar below the menu bar, click on the Lin-Log layout tool, as shown below.

Description of this image Result: The new layout provides a visual representation of the graph clusters in the Property graph pane, similar to what is shown below:

Description of this image -
Now, use name property of vertices as labels on the screen. Right click on the Property graph pane and select Apps > Show label value > name from the menu, as shown here:

Description of this image Result: Vertex ID values are replaced with the name property values.
-
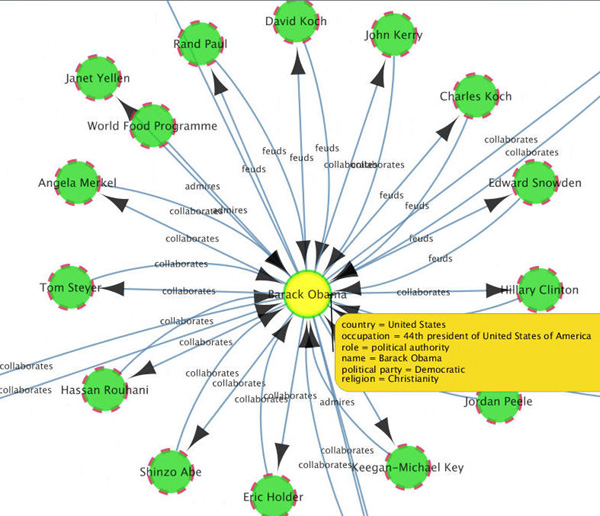
Finally, you can show property values for any vertex by using the right-mouse menu.
A. First, use the Zoom in toolhighlighted in the image below to zoom in on the center "Barack Obama" vertex cluster, as shown below.

Description of this image B. Then, right-click on the "Barack Obama" vertex and select Apps > Show properties from the menu.
Result: All properties of the vertex are shown in a yellow text box, as shown here:
Description of this image -
Feel free to navigate the graph and inspect the properties of other verticies. When you are done, quit the Cytoscape application, and don't save the results.
- Finally, close any open terminal windows. Note: Ignore any warning and simply close,