Before You Begin
Purpose
This tutorial covers the use of Oracle Big Data Statial and Graph to perform analysis using Spatial Raster functionality. You will learn how to:
- Use the Raster Console - ImageServer to run spatial analysis and visualize spatial results
- Use the command line to perform spatial raster anaysis
Time to Complete
Approximately 60 mins
Background
Oracle Big Data Spatial and Graph contains three key components:
- A wide range of spatial analysis functions and services
- A distributed property graph database with over 35 in-memory parallel graph analytics
- A multimedia framework for distributed processing of video and image data in Apache Hadoop
What Do You Need?
- Have access to Oracle Big Data Lite Virtual Machine, version 4.8 or higher.
Prepare the Hands-on Environment
In order to complete this tutorial, you must perform the following tasks:
- Download and install the spatial analysis support files
- Create a working directory in HDFS
- Load spatial data to the HDFS directory
NOTE: If you have already completed the tutorial Oracle Big Data Spatial and Graph: Spatial Vector Analysis, skip this section and go directly to the next topic.
Follow these steps to prepare the hands-on environment:
-
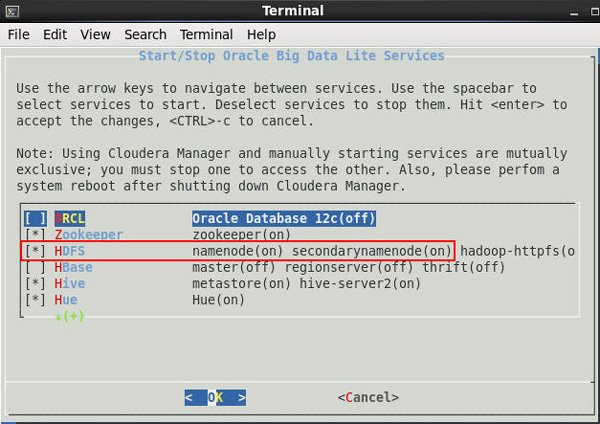
Double-click the Start/Stop Services icon the VM desktop to open a terminal window that shows a list of Oracle Big Data Lite Services.
-
Check the status of the HDFS service. Ensure that is is started (as shown below).
Description of this image Notes:
- If the service is started, close the terminal window, and move on to Step 3.
- If the service is not started, perform steps 2.A. through 2.C:
A. Use the down arrow key to highlight the HDFS option.
B. Press the Spacebar to select the option.
C. Press the Enter key to start the HDFS service. Note: After HDFS starts up, the terminal window automatically closes.
-
Enable proxy access in the browser. To do this:
- Open the browser by using the Start Here desktop icon, as shown below.
- In the browser, right-click just above the Address box and enable the Menu Bar option.
- Then, select Edit > Preferences > Advanced > Network > Settings from the menu.
- In the Connection Settings dialog, select the Auto-detect proxy settings for this network option (as shown below) and click OK.

Description of this image 
Description of this image 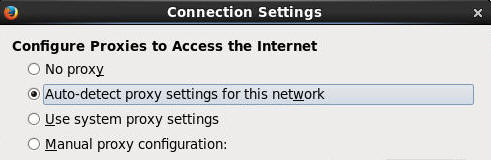
Description of this image -
Next, ensure that pop-up blocking is disabled. To do this:
A. select the Content category in the Preferences window navigator. In the Content window, deselect the Block pop-up windows option, as shown here:

Description of this image B. Close the browser.
-
Re-open the browser go to the Learn More section of the Big Data Spatial and Graph page at: http://www.oracle.com/technetwork/database/database-technologies/bigdata-spatialandgraph/learnmore/index.html. Then, perform the following:
A. Scroll down to the Hands On Lab section.
B. Click the "Applying Spatial Analysis to Big Data" link to download the BDL-4.6-Spatial-HOL.zip file. NOTE: Use the 'Save File' option in the menu.
- Close the browser and click the Terminal icon to open a terminal window, as shown here:

Description of this image NOTE: Hints for using code segments in the terminal window:
- To execute code, individually copy/paste code lines from the provided code segments to the command line interface.
- Then, execute each line of code at the command line by pressing
Enter. -
In the terminal window, execute the following lines of code to: A) Unzip the Vector-HOL.zip file to the specific directory, and B) Make the directory writeable.
cd Downloads unzip BDL-4.6-Spatial-HOL.zip cd BDL-4.6-Spatial-HOL/setup sudo unzip Vector-HOL.zip -d /opt/oracle/oracle-spatial-graph/spatial/vector/HOL sudo chmod -R 777 /opt/oracle/oracle-spatial-graph/spatial/vector/HOL -
Now, execute the following line of code to unzip the Raster-HOL.zip file to the specific directory.
sudo unzip Raster-HOL.zip -d /opt/oracle/oracle-spatial-graph/spatial/raster/ -
Finally, execute the following two lines of code to start Tomcat:
sudo service bdsg start
sudo service bdsg status
RESULT: The following output should appear: "Oracle BigData Spatial and Graph Consoles are started". This output, following the status command, indicates that the Tomcat servlet is running and Spatial consoles are started:
-
Next, create a working directory in HDFS by executing the following command:
hadoop fs -mkdir /user/oracle/HOL -
Finally, load the data for this tutorial into HDFS by executing the following four lines of code:
hadoop fs -put /opt/oracle/oracle-spatial-graph/spatial/vector/HOL/data/tweets.json /user/oracle/HOL/tweets.json
hadoop fs -put /opt/oracle/oracle-spatial-graph/spatial/vector/HOL/data/USA_2012Q4_PCB3_PLY.dbf /user/oracle/HOL/USA_2012Q4_PCB3_PLY.dbf
hadoop fs -put /opt/oracle/oracle-spatial-graph/spatial/vector/HOL/data/USA_2012Q4_PCB3_PLY.shp /user/oracle/HOL/USA_2012Q4_PCB3_PLY.shp
hadoop fs -put /opt/oracle/oracle-spatial-graph/spatial/vector/HOL/data/USA_2012Q4_PCB3_PLY.shx /user/oracle/HOL/USA_2012Q4_PCB3_PLY.shx
Use the Spatial Raster Console - Imageserver
In this section, you learn how to perform several tasks associated spatial raster analysis by using the Raster Console - ImageServer.
These include:
- Loading images into HDFS
- Selecting the images for processing
- Creating a mosaic of the images
- Adding custom functionality to the processing, by using the Raster Console - ImageServer.
Complete the following topics in order:
Load Raster Images to HDFS and Create a Basic Mosaic
In this topic, you install the Cartographic Projections library, load raster images to HDFS, and then create a basic mosaic from the images.
First,download the Cartographic Projections library and perform several related operations outlined in the next several steps:
-
Open a terminal window and execute the following two lines of code:
sudo service bdsg stop sudo service bdsg status - Next, Launch Firefox and download this tarball (http://download.osgeo.org/proj/proj-4.9.1.tar.gz) to ~/Downloads.
-
In the terminal window, untar the library source code by executing the following two lines of code:
cd ~/Downloads tar -xzf proj-4.9.1.tar.gz -
Configure, make, and install PROJ.4, by executing the following four lines of code:
cd proj-4.9.1
./configure
make
sudo make install
Result: libproj.so is now available at /usr/local/lib/.
-
Create a link to the libproj.so file in the spatial installation directory by executing the following command:
sudo ln -s /usr/local/lib/libproj.so /opt/oracle/oracle-spatial-graph/spatial/raster/gdal/lib/libproj.so -
Provide read and execute permissions for the libproj.so library for all users by executing the following command:
sudo chmod 755 /opt/oracle/oracle-spatial-graph/spatial/raster/gdal/lib/libproj.so -
Restart Tomcat and Spatial consoles by executing the following command.
sudo service bdsg startNext, use the Raster Console to load raster image files into HDFS.
-
Open a new tab in the browser by clicking on the New Tab tool.
-
Then, select Spatial and Graph > Oracle Spatial Raster Console from the toolbar, as shown here:
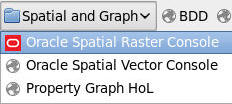
Description of this image -
Select the Hadoop Raster Loader tab. Then, under the Input section, click the Add an input folder or file tool, as shown here:
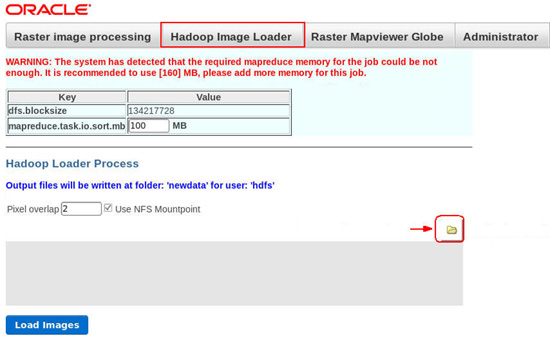
Description of this image -
A. In the File System dialog, navigate to the /opt/shareddir/spatial/data/rasters directory.
B. Then, using the CTRL key, multi-select the following three images (hawaii.tif, kahoolawe.tif, maui.tif), and click OK, as shown here:.

Description of this image Result: The three images are added to the Input list, as shown here:

Description of this image -
Then, click the Load Images button, located just below the image file list.
Result: When the images have been transfered to the HDFS system, a message similar to the following is displayed:
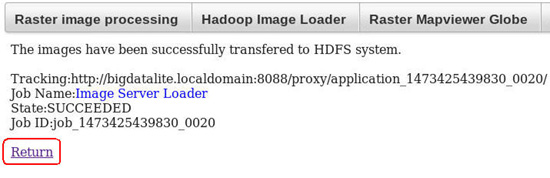
Description of this image -
As shown in the image above, click Return.
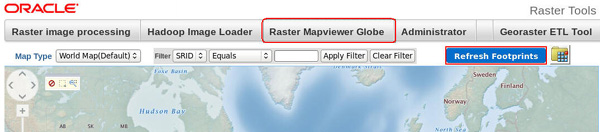
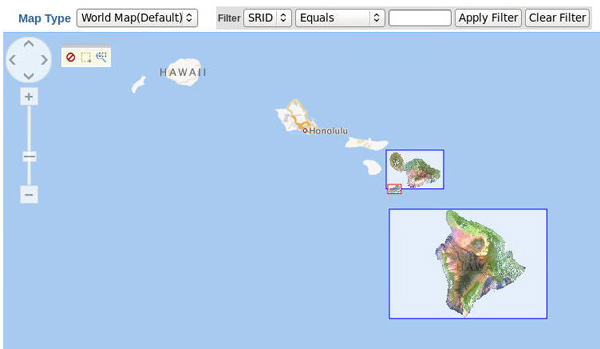
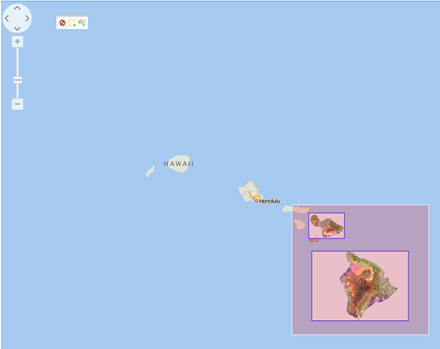
- Next, select the Hadoop Raster Viewer tab, select the World Map map type, and then click on Refresh Footprints, as shown here:
Description of this image Notes:
- Wait until the image is refreshed.
- Using the Slider, zoom in on the map so that only the United States is visible.
- Then drag the map toward the Pacific Ocean, and zoom in on the location of the Hawaian lslands.
You should see the following, with all three features drawn and highlighted:
Description of this image -
Click on each of the footprints individually. A thumbnail of the selected image appears, providing additional information about the image, as shown below:
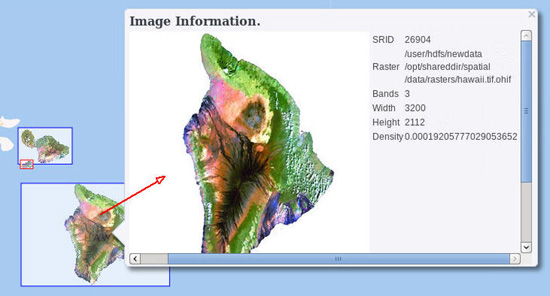
Description of this image -
First, as shown in the image below, click the Select Footprints tool at the upper left of the map. This action prepares the map for a mosaic area selection.

Description of this image -
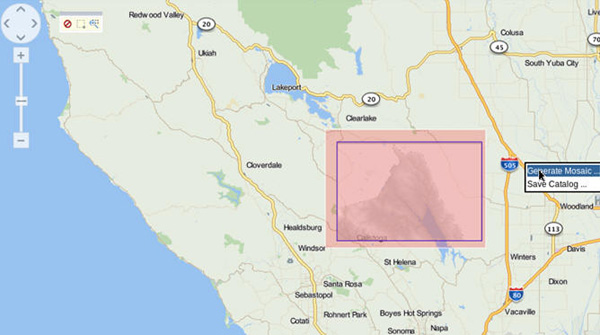
Next, use the mouse to select all three footprints, as shown below:
Description of this image Note: This action defines sub set operations on the rasters that are included within the selection.
-
Next, right-click on the map outside of the selection, and choose Generate Mosaic from the pop-up menu.
Result: An HDFS Resource Manager form appears. In the form, coordinates, size and SRID values are generated automatically from the selected rasters.
-
In the form, you provide an output name for the mosaic. As highlighted in the image below, you first must click the elipses button to open a dialog for this purpose.
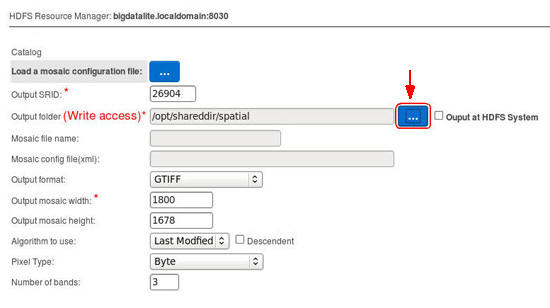
Description of this image -
In the output file name dialog, enter HawaiiMosaic as the name and click Ok.
-
Then, click the Create Mosaic button to start the mosaic and the subset operations generation.
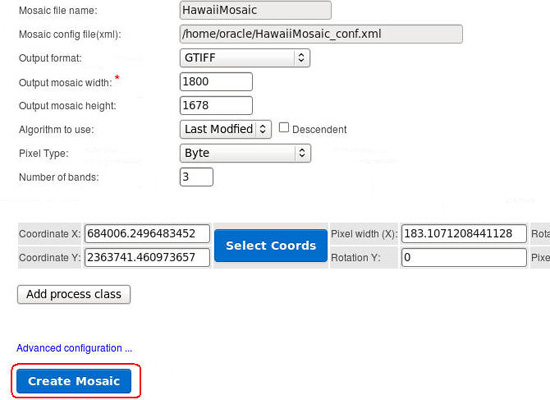
Description of this image -
When the job is complete, the mosaic image is generated and displayed in a separate window, as shown here:
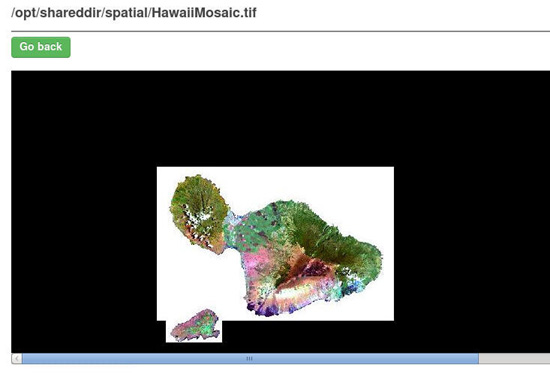
Description of this image Notes: Use the window scroll bars to view more of the output.

Description of this image Notes: Optionally, you can scroll down in the window and select the Download mosaic to save the mosaic locally. Or, if you want to generate a new mosaic with a different configuration, select the Go Back button.
-
When you are done viewing the mosaic, close the output window.
Result: Oracle BigData Spatial and Graph Consoles are stopped.
When you are done viewing additional information about the images, close the last thumbnail tab. Next, you learn how to create a basic mosaic.
Load a DEM Image and Calculate Slope
In this topic, you load a special raster image called a DEM, or Elevation Mode image, which supports a slope calculation for three-dimensional viewing. You will visualize this image by loadiong a custom jar into the image server.
NOTE: You must succesfully complete this topic in order to perform the next topic.
Follow these steps:
-
In the browser, open a new tab and go back to Spatial and Graph > Oracle Spatial Raster Console.
-
In the Image Server window, select the Hadoop Raster Loader tab. As before, navigate to and select the /opt/shareddir/spatial/data/rasters/NapaDEM.tif image as shown here:
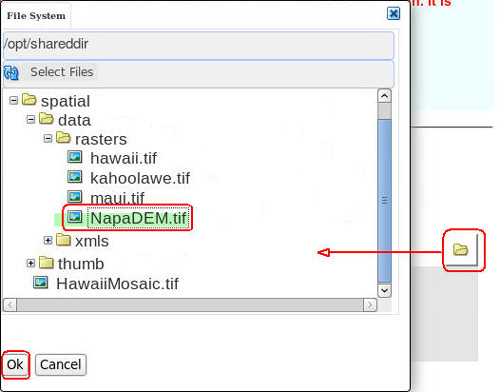
Description of this image -
Click OK.
-
Then, click the Load images button, and wait for the image to be loaded.
Result: When the image has been transfered to the HDFS system, the following message appears:

Description of this image -
Click Return.
-
Select the Hadoop Raster Viewer tab, select World Map as the Map Type, and then and click on the Refresh Footprints button as before.
Result: The message "Features Loaded: 4" appears next to the Refresh Footprints button, and the image is refreshed.
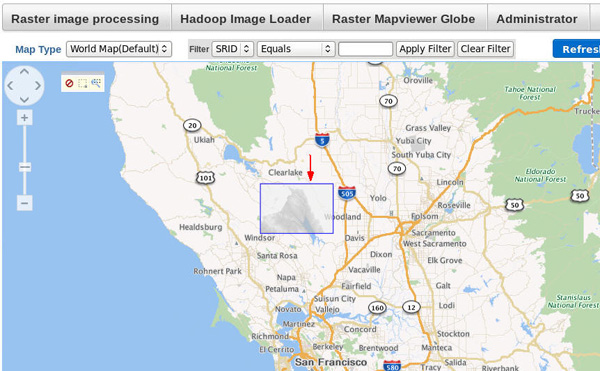
Description of this image -
Using the mouse, relocate the map to center on California, and zoom in on the Napa Valley area, as shown below.
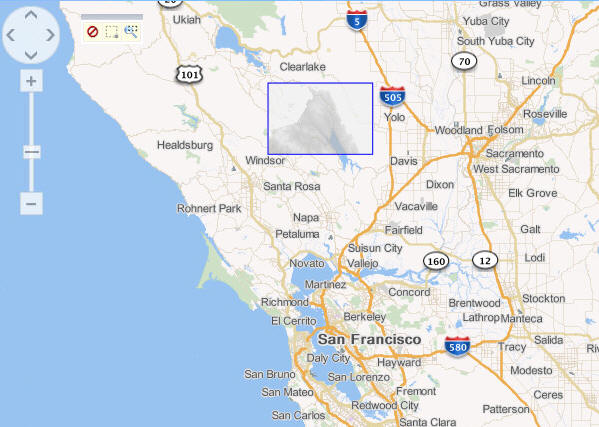
Description of this image Note: As highlighted in the image above, the features for the NapaDEM image have been loaded for the the map. The footprint section of the map that is associated with these features is also highlighted.
Next, you will create a mosaic of this footprint in using the same technique that you learned in the previous topic.
-
First, click the Select Footprints tool at the upper left of the map.
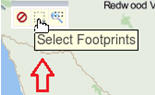
Description of this image -
Now, Use the mouse to select the entire footprint area. Right-click on the map outside of the selection to display a pop-up menu, and select Generate Mosaic as shown below:
Description of this image Result: A Mosaic form appears, with coordinates, size and SRID values automatically generated, as you observed previously.
-
In the form, specify the Output folder value by using the elipses button. Enter slope as the file Mosaic file name.
-
Still in the form, select Float 32 Bits as the pixel type (this is a 32 bit image), as shown below:

Description of this image -
Next, click the Add process class button.
-
Then, provide the name of the class that will perform the slope calculation, which is: oracle.spatial.hadoop.imageprocessor.process.ImageSlope
Result: The lower portion of the form should now look like this:
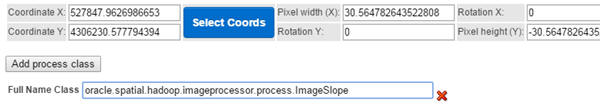
Description of this image Note: The Full Name Class is the fully class qualified name, including the package name.
-
Finally, click the Advanced configuration... link, and provide the algebra operation as shown below, by performing the following:
- Select the localif function.
- Click on Add Operation
- Specify the following parameter values for localif as shown below:
- Operators = Greater Than
- Operand = 2500
- New value = 3900
Result: The Operations section should look like this:
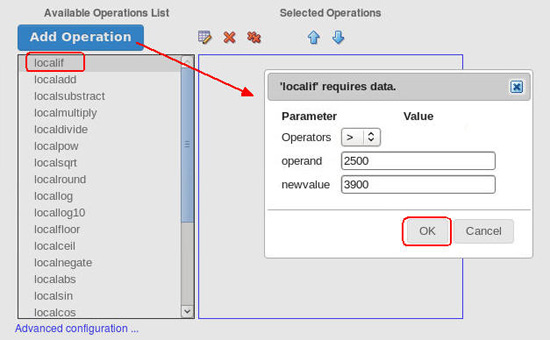
Description of this image - As shown above, click OK to save the configuration.
- Click the Create Mosaic button to start the mosaic generation process.
Result: As before, while the job is running you can view the running applications page by going to http://localhost:8088/cluster/apps in your browser. Click on the Running link as shown below to refresh the page.
Result: When the job is complete,the mosaic image is generated. However, it is not fully visible in the Image Server viewer, as shown below:
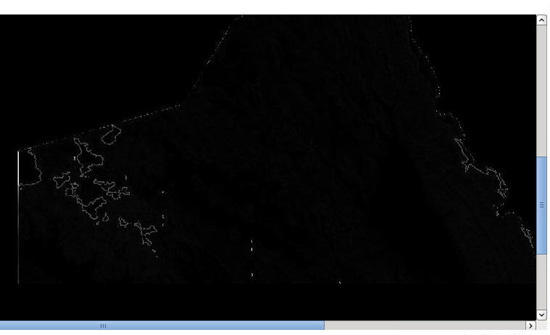
Description of this image -
Close the image viewer window.
Notes:
- In order to fully visualize the image, you could download the image using the Download mosaic button. Then, you can copy to a Windows machine and open the file using Windows Photo Viewer. This is an optional step.
- The following screenshot shows how this image looks using Windows Photo Viewer, including the slope aspects:
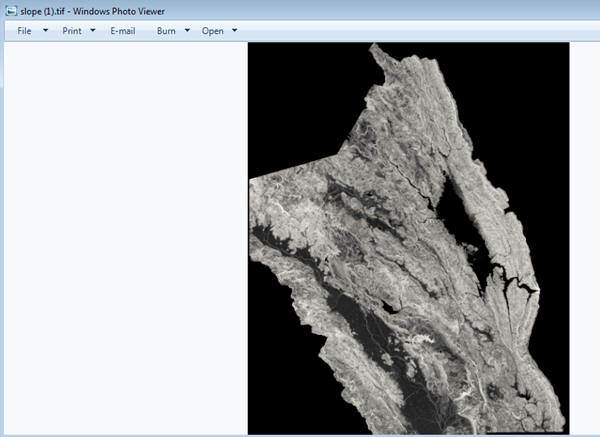
Description of this image
Calculate Hillshade on a DEM Raster
In this topic, you use the same the raster image from the previous topic. Here, you will use an external jar file with the image, as an example of how the spatial raster framework can be extended. In addition, you learn how to perform new raster analysis calculation, called Hillshade.
Follow these steps:
-
In the Georaster Tools window, select the Administrator tab. Note: Ignore the "Save the changes permanetly" message.
-
Scroll down to the "Upload user jars for mosaic processing" section Then, click the Browse button, as shown below:

Description of this image -
In the File Upload dialog, navigate to the /opt/oracle/oracle-spatial-graph/spatial/raster/Raster-HOL/jlib directory and select the external-analysis.jar file. Finally, click Open, as shown below:
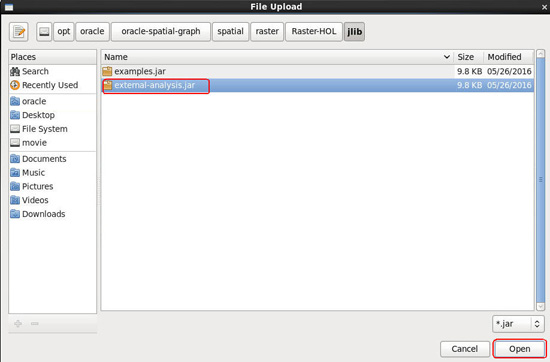
Description of this image -
Then, click Upload to add the custom jar to the imageserver.
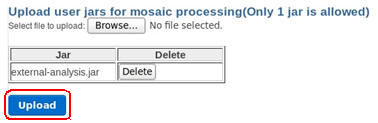
Description of this image Result: When the jar successfully uploads, a message appears that states the new jar has been added.
-
Then, click Return to Console.
-
Now, select the Hadoop Raster Viewer tab, click the Remove Selection tool, and click Refresh Footprints.
-
Once again, click the Select and crop coordinates of Footprints tool at the upper left of the map.
Description of this image -
Use the mouse to select the entire footprint area, right-click on the map outside of the selection, and choose Generate Mosaic from the menu, as shown below:
Description of this image Result: As before, a HDFS Resource Manager form appears, with coordinates, size and SRID values automatically generated.
-
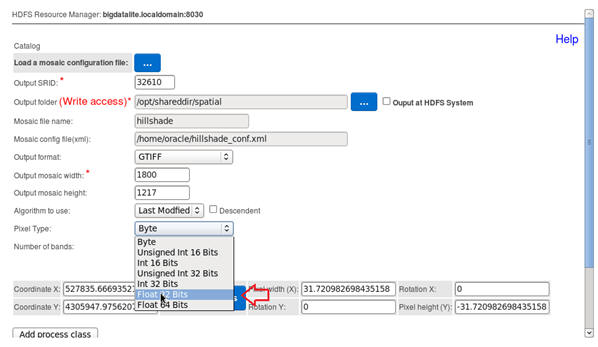
In the form, use the elipses button to specify hillshade as the Mosaic file name.
-
Still in the form, select Float 32 Bits as the pixel type, as you did previously.
Description of this image -
Next, click the Add process class button and enter oracle.spatial.raster.HillShade as the Full Name Class.
Result: The lower portion of the form should now look like this:
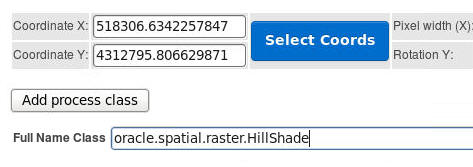
Description of this image -
Click Create Mosaic as shown above to generate mosaic.
Note: Wait for the result, as the image may take a few moments to appear.
Result: The hillshade mosaic image should look like this:
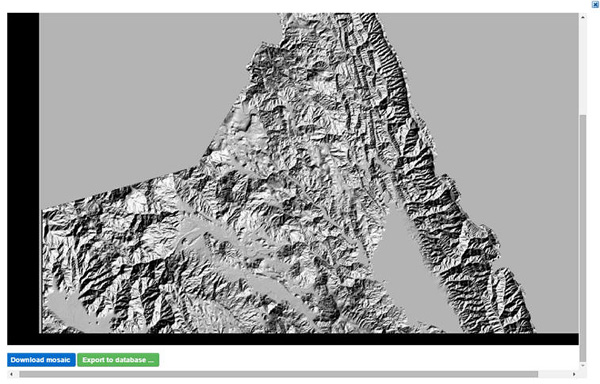
Description of this image -
Close the image viewer window and then close the browser.
Use the Command Line for Spatial Raster Analysis
In the previous section, you learned how to run jobs and display their results in the ImageServer Raster Console. Now, you learn how to run spatial raster jobs from the command line.
Before you can perform the following exercises, you must first prepare the HDFS environment, Therefore, perform the following two steps before moving on to the remaining exercises:
1. First, open a new terminal window and execute the two sudo commands shown below.
Notes:
- The first command ensures that the libproj.so native library has execute permission for all users.
- The second command ensures that the /opt/oracle/oracle-spatial-graph/spatial/raster/Raster-HOL/data/xml directory has write permissions for all users.
sudo chmod 755 /opt/oracle/oracle-spatial-graph/spatial/raster/gdal/lib/libproj.so
sudo chmod -R 757 /opt/oracle/oracle-spatial-graph/spatial/raster/Raster-HOL/data/xml
2. Second, run the following export command, which modifies the HADOOP_CLASSPATH environment variable to include all jars that are required for job execution.
export HADOOP_CLASSPATH=/opt/oracle/oracle-spatial-graph/spatial/raster/jlib/hadoop-imageprocessor.jar:/opt/oracle/oracle-spatial-graph/spatial/raster/jlib/hadoop-raster-fwk-api.jar:/opt/oracle/oracle-spatial-graph/spatial/raster/jlib/gdal.jar:$HADOOP_CLASSPATHLoad a Set of Raster Images
In this exercise, you load a set of raster images with different resolutions, data types and SRID´s, into HDFS.
Theses images include the four that you have worked with in previous exercises:

Follow these steps:
-
Using a terminal window, execute the following long line of code, which includes several required parameters, in order to load the images:
hadoop jar /opt/oracle/oracle-spatial-graph/spatial/raster/jlib/hadoop-imageloader.jar -files /opt/oracle/oracle-spatial-graph/spatial/raster/Raster-HOL/data/raster/hawaii.tif,/opt/oracle/oracle-spatial-graph/spatial/raster/Raster-HOL/data/raster/kahoolawe.tif,/opt/oracle/oracle-spatial-graph/spatial/raster/Raster-HOL/data/raster/maui.tif,/opt/oracle/oracle-spatial-graph/spatial/raster/Raster-HOL/data/raster/NapaDEM.tif -out exercise0 -overlap 10 -thumbnail /opt/shareddir/spatial -gdal /opt/oracle/oracle-spatial-graph/spatial/raster/gdal/lib -gdalData /opt/oracle/oracle-spatial-graph/spatial/raster/gdal/data -
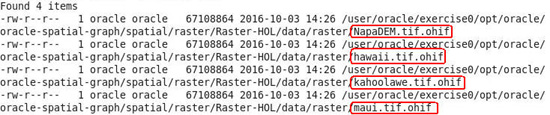
Once the job is finished, execute the following command to verify that this the raster images loaded correctly.
hdfs dfs -ls /user/oracle/exercise0/opt/oracle/oracle-spatial-graph/spatial/raster/Raster-HOL/data/rasterYou should see a list of images files, as shown here:
Description of this image -
Leave the terminal window open.
Process a Mosaic Operation
In this exercise, you process the three Hawaii raster images that you just loaded by extracting them and creating a mosaic with them.
Before running the job, view two .xml files that are used in the raster processing. Both files are located in the /opt/oracle/oracle-spatial-graph/spatial/raster/Raster-HOL/data/xml directory. In our example, we use gedit to open the files.
First, the index.xml file is opened:
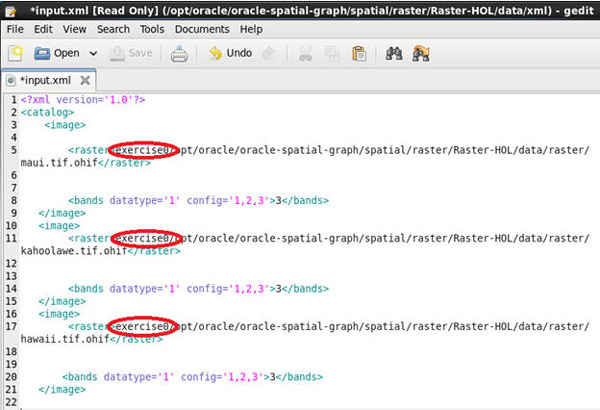
Notes: The raster directory set in HDFS includes “exercise0” as part of the path for each raster in the catalog, since this is the directory used for output in the loader process.
Second, the testFS.xml file is opened:
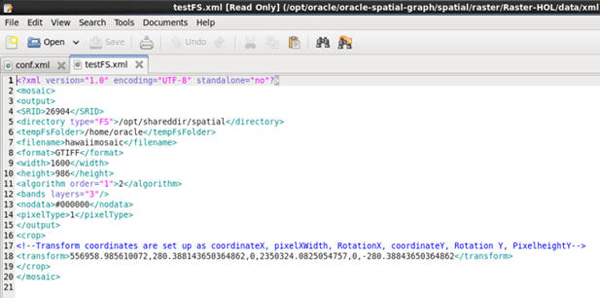
Notes: As shown, the xml code defines a mosaic that includes all three rasters. The specified coordinates in the transform element includes 3 bands, an SRID of 26904, and GTIFF format. In addition, the directory type element specifies that the mosaic file output will be located in NFS.
To run the raster image process job, perform the following:
-
In the terminal window, execute the following long command to process the catalog and mosaic.
hadoop jar /opt/oracle/oracle-spatial-graph/spatial/raster/jlib/hadoop-imageprocessor.jar -catalog /opt/oracle/oracle-spatial-graph/spatial/raster/Raster-HOL/data/xml/input.xml -config /opt/oracle/oracle-spatial-graph/spatial/raster/Raster-HOL/data/xml/testFS.xml -gdal /opt/oracle/oracle-spatial-graph/spatial/raster/gdal/lib -gdalData /opt/oracle/oracle-spatial-graph/spatial/raster/gdal/dataResult: When the job is finished, all the rasters in the catalog will be combined in a single raster output based on the configuration xml details.
-
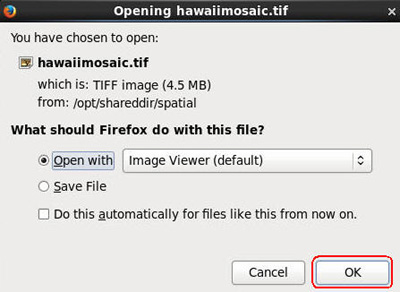
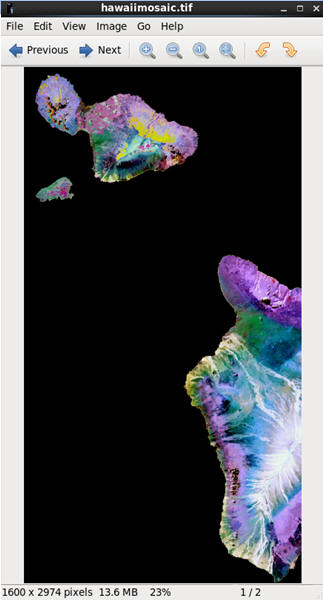
Launch the broswer and open a new tab. Then open the /opt/shareddir/spatial/hawaiimosaic.tif file. Click OK to accept the default viewer, as shown below:
Description of this image Result: The mosaic should look like this:
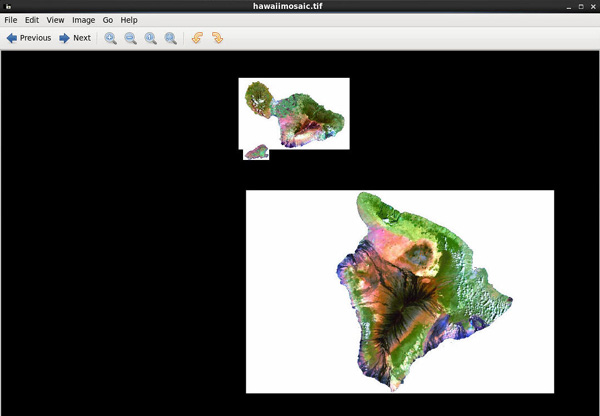
Description of this image Note: All the three of the catalog rasters are together in this mosaic.
-
When done viewing the image, close the window.
Process a Mosaic Using a Subset Operation and Raster Algebra Function
This exercise uses the Hawaii raster images loaded previously. Here, you extract a subset of the rasters and transform the pixels using a raster algebra function called localnot. (This function was also used in one of the exercises in the Raster Console topic.) In this case, localnot inverts every bit in the pixels before creating a mosaic.
As with the previous exercise, two .xml files are used in the processing job. And again, both files are located in the /opt/oracle/oracle-spatial-graph/spatial/raster/Raster-HOL/data/xml directory.
The first file is the same index.xml file that was used previously, shown here:.
The second file used for this processing job is testFSPartial.xml, shown below:
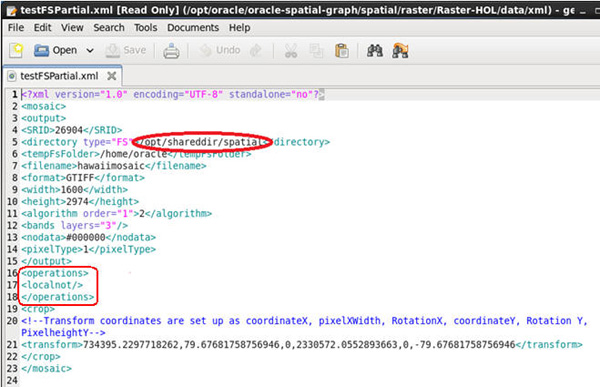
Notes:
- In this case, the xml code defines a mosaic that includes all three rasters with the same coordinates in the transform elements (3 bands, an SRID of 26904, and GTIFF format) as used in the previous exercise. And again, the directory type element specifies that the mosaic file output will be located in NFS.
- However, in this case the transform coordinates are changed from the last exercise. Now the mosaic has a minor pixelWidth and pixelHeight, which will cut off the last island on the right (the hawaii.tif raster), and you will visualize this on the mosaic when the output is processed.
- In addition, there is a new element in this xml, <operations>, where localnot operation is defined. This section of the xml is highlighted in the screenshot above. As mentioned previously, this operation inverts the bits in every pixel and is part of the supported raster algebra operations included in the framework.
To run this raster image process job, perform the following:
-
Back in the terminal window, execute the following long command to process the catalog and mosaic.
hadoop jar /opt/oracle/oracle-spatial-graph/spatial/raster/jlib/hadoop-imageprocessor.jar -catalog /opt/oracle/oracle-spatial-graph/spatial/raster/Raster-HOL/data/xml/input.xml -config /opt/oracle/oracle-spatial-graph/spatial/raster/Raster-HOL/data/xml/testFSPartial.xml -gdal /opt/oracle/oracle-spatial-graph/spatial/raster/gdal/lib -gdalData /opt/oracle/oracle-spatial-graph/spatial/raster/gdal/data -
After the job finishes, open a new tab in the browser and open /opt/shareddir/spatial/hawaiimosaic.tif. The mosaic file is shown below:
Description of this image Notes: In this example, the last island on the right is cut, this is a result of the transform coordinates set in the mosaic configuration. This is an example of subset operation. Also, you may notice the change in the pixels colors, which is a result of applying the localnot operation.
-
When done viewing the image, close the window.
Process a Raster Using the Slope Function
In this exercise, you process the Napa Valley Elevation Model loaded in HDFS previously. In this case, the localif function is applied.
As with the previous exercise, two .xml files are used in the processing job. And again, both files are located in the /opt/oracle/oracle-spatial-graph/spatial/raster/Raster-HOL/data/xml directory.
The first file is inputDEM.xml, which is shown here:.
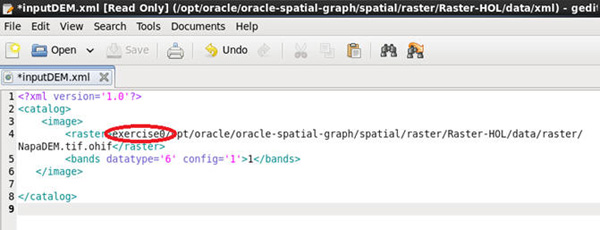
Notes: Again, the raster directory contains “exercise0” as part of the path for the raster in the catalog. As in previous examples, this file will be used when executing the job to set the catalog using the –catalog option.
The second file used for this processing job is testSlopeFS.xml, shown below:
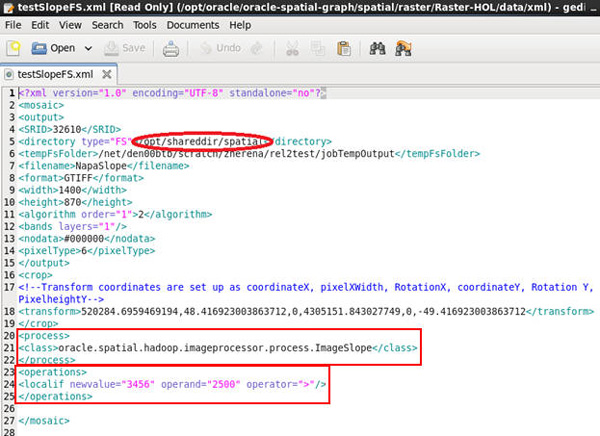
Notes: In addition to options that have been previously specified, this xml file uses the <process> element, which indicates the ImageSlope class. When executed as part of the process, the mosaic output will show the slope according to its neighboring pixels. Also, the <operations> element sets the localif function. This operation updates the value of every pixel where its original elevation is greater than 2500.
To run this raster image process job, perform the following:
-
Back in the terminal window, execute the following long command to process the catalog and mosaic.
hadoop jar /opt/oracle/oracle-spatial-graph/spatial/raster/jlib/hadoop-imageprocessor.jar -catalog /opt/oracle/oracle-spatial-graph/spatial/raster/Raster-HOL/data/xml/inputDEM.xml -config /opt/oracle/oracle-spatial-graph/spatial/raster/Raster-HOL/data/xml/testSlopeFS.xml -gdal /opt/oracle/oracle-spatial-graph/spatial/raster/gdal/lib -gdalData /opt/oracle/oracle-spatial-graph/spatial/raster/gdal/dataNotes: After the job finishes, the /opt/shareddir/spatial directory contains the mosaic, as shown here:

Description of this image However, recall that the output raster with the slope cannot be visualized in Linux environment with the standard image tools. Therefore, the mosaic file is shown below in a Windows environment using Windows Photo Viewer:
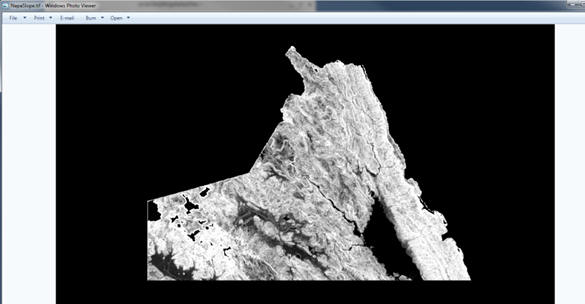
Description of this image -
In the Big Data VM, close the browser and all open terminal windows.
Want to Learn More?
-
For more practice on job customization, see additional code examples on the Big Data Lite VM at /opt/oracle/oracle-spatial-graph/spatial/vector/examples.
- For customized job examples, see additional exercises at: http://www.oracle.com/technetwork/database/database-technologies/bigdata-spatialandgraph/learnmore/index.html -> Hands On Labs -> Applying Spatial Analysis to Big Data/opt/oracle/oracle-spatial-graph/spatial/vector/examples.