Before you begin
This 25-minute hands-on tutorial shows you how to plan for balance sheet and cash flow in Financials. The sections build on each other and should be completed sequentially.
Background
Financials delivers tools to help you quickly develop plans and forecasts, and generate core financial statements such as balance sheets, cash flow statements, and income statements for internal analysis. Financials provides these components that you can enable incrementally to best meet your business needs:
- Revenue / Gross Margin
- Expense
- Balance Sheet
- Cash Flow
- Income Statement
- Analysis
Financials provides a framework that uses driver-based, trend-based, and direct-input accounts that fully integrate with your income statement, balance sheet, and cash flow statements.
This tutorial focuses on planning balance sheet and cash flows, and how they are closely linked to the income statement plans.
You can plan for current assets such as accounts receivable and inventory, and fixed assets such as depreciation. And you can plan for liabilities such as accounts payable, short term loans, or equity such as retained earnings. Retained earnings is derived automatically.
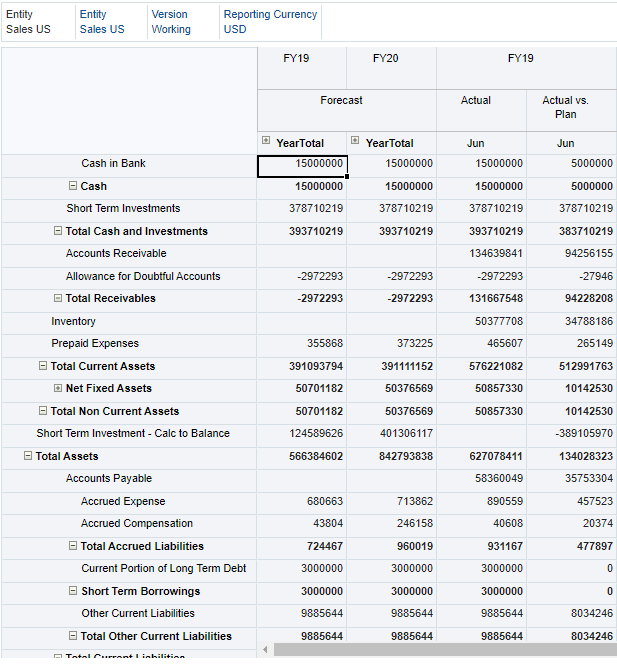
For some balance sheet accounts, you can use drivers to calculate the account’s value. For example, you can use drivers such as Days Sales Outstanding (DSO) for calculating Accounts Receivable, and Days in Inventory for calculating Inventory.
For other accounts, such as Cash in Bank, you can plan using trends.
For accounts which are not driver or trend based, such as Short Term Investments, you can directly enter values.
Cash flow is calculated indirectly from changes to non-cash accounts on the balance sheet and income statement. Cash flow reporting derives the cash flow based on changes to balance sheet accounts such as accounts receivable, inventory, accounts payable, depreciation, and other investments. You can make adjustments to your derived cash flow.
What do you need?
An EPM Cloud Service instance allows you to deploy and use one of the supported business processes. To deploy another business process, you must request another EPM Enterprise Cloud Service instance or remove the current business process.
- Have Service Administrator access to EPM Enterprise Cloud Service. The instance should not have a business process created.
- Upload and import this snapshot into your Planning instance.
For more information on uploading and importing migration snapshots, refer to the Administering Migration for Oracle Enterprise Performance Management Cloud documentation.
Setting user variables
User variables are added when the business process is created. User variables act as filters in forms, enabling planners to focus only on certain members. Planners must select values for their user variables before opening forms and dashboards.
- On the home page, click Tools, then User Preferences.
- On the left, click User Variables.
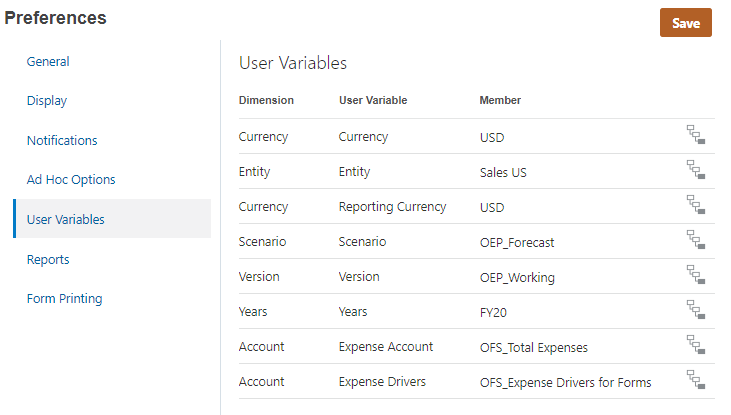
- Enter the following members for the user variables:
- Currency: USD
- Entity: Sales US
- Reporting Currency: USD
- Scenario: OEP_Forecast
- Version: OEP_Working
- Years: FY20
- Expense Account: OFS_Total Expenses
- Expense Drivers: OFS_Expense Drivers for Forms
You can use Member Selector to select members.
- Click Save. When prompted, click OK.
- Return to the Planning home page.
Planning for driver-based accounts
In this section, you view values for Accrued Expenses and Accounts Receivable, then you adjust values for the drivers for these accounts and view the effects on the account balances.
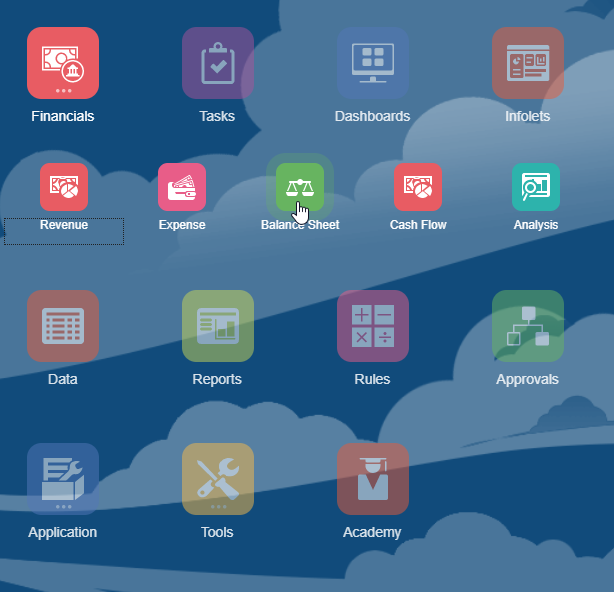
- From the Planning home page, click Financials, then click Balance Sheet.
- On the left, click (
 ) Driver and Trend Based.
 - Select the Balance Sheet - Forecast tab. Notice that the forecast for Accounts Receivable in FY20 is over 51 million.

- Scroll down to view the Accrued Expense forecast, which is over 680 thousand.

- To update the drivers for these accounts, select the Driver Based Balance Sheet Planning tab.
- Make sure that the POV is set to Sales US, Forecast, Working, USD, and FY20.
- In this case, Accounts Receivable is derived from the days sales outstanding (DSO) driver, and Accrued Expense is derived as a percentage of Operating Expenses. Include a 3-day increase for DSO and a 2% increase for accrued expense. Enter the following data:
- DSO - Adjustment (+/-): 3
- Accrued Expense % of Opex - %Increase/(Decrease): 2%
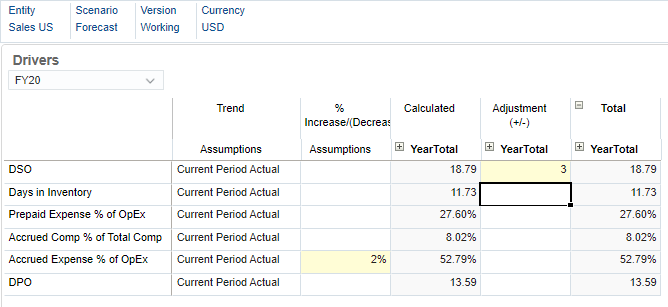
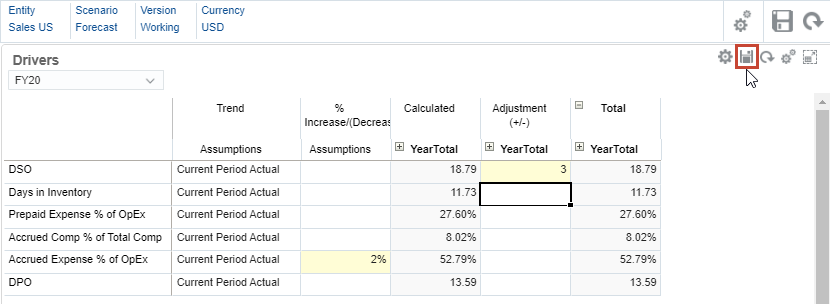
- In the form toolbar (not the dashboard toolbar), click (
 ) Save.
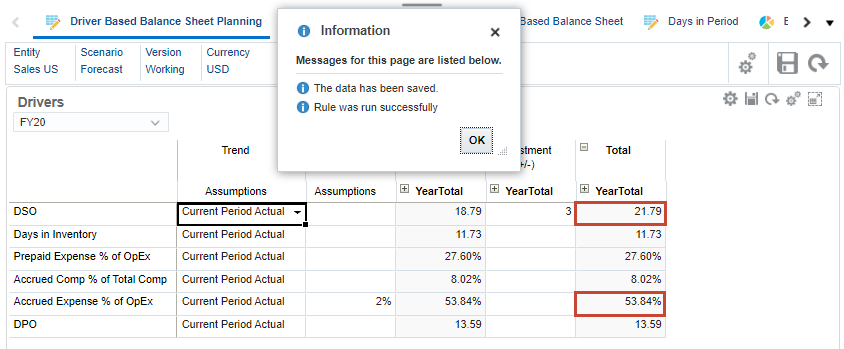
- When a message displays that data has been saved and recalculated, click OK.
The adjusted driver values are displayed in the form.
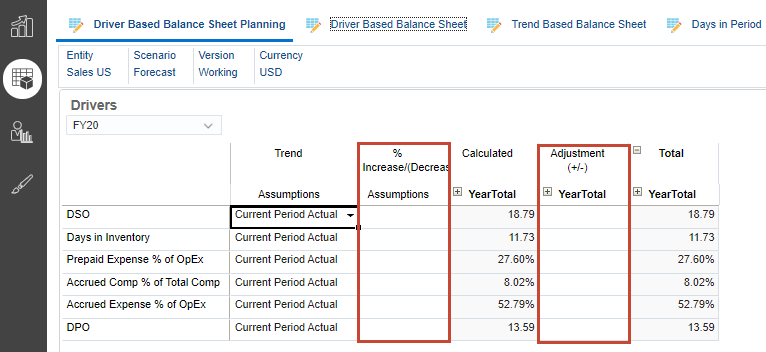
- Click the Driver Based Balance Sheet tab to view the calculated driver-based Balance Sheet accounts. Notice that Accounts Receivable (derived from DSO—the number of days it takes to receive funds from customers for purchased goods and services) has increased to 59.8 million, and Accrued Expense has increased to almost 694 thousand.

You can also enter additional adjustments on this tab.
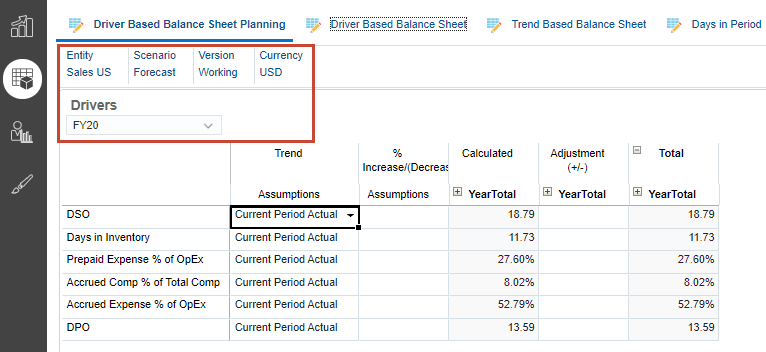
These drivers are set to be calculated from the current period's actuals. This tab has two data entry columns that let you enter assumptions of a percentage increase or decrease to the driver, and numeric adjustments to the driver values.
Planning for trend-based accounts
For non driver-based accounts, you can create reliable future plans based on trends. For example, say you expect to better manage your cash. In this section, you adjust trend values to decrease your cash surplus.
- Select the Trend Based Balance Sheet tab.
- For Cash in Bank, in the % Increase/(Decrease) column, enter -5%.
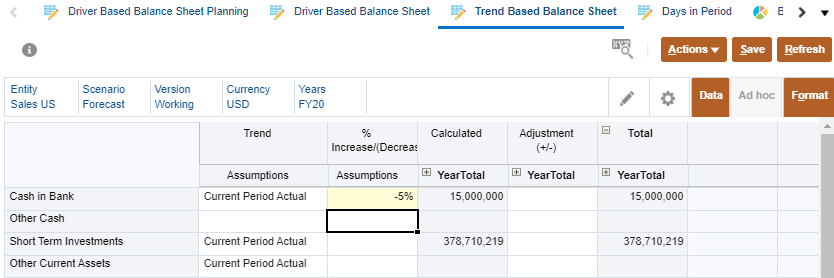
- Click Save. A message is displayed that the data was saved and recalculated.
Notice that the value for Cash in Bank is reduced.
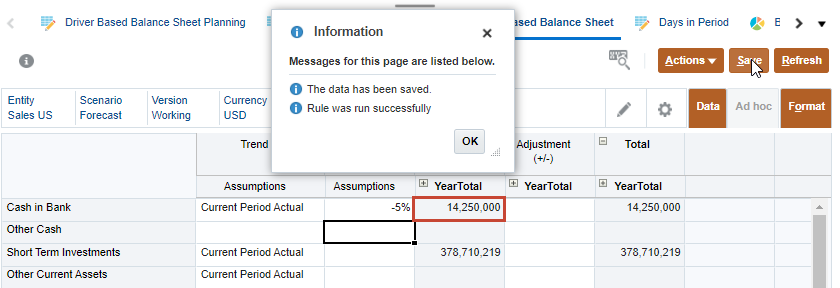
- Click OK to close the message.
- Similar to driver-based accounts, you can adjust the trend up or down by a percentage (as you just did) and make adjustments to the calculated value. For Cash in Bank, in the Adjustment (+/-) column, enter 10k.
In Planning forms, you can use data entry shortcuts like 10k for 10,000, 5m for 5,000,000, and so on.

- Click Save. A message is displayed that the data was saved and recalculated.
Notice that the total value for Cash in Bank is increased by 10,000.
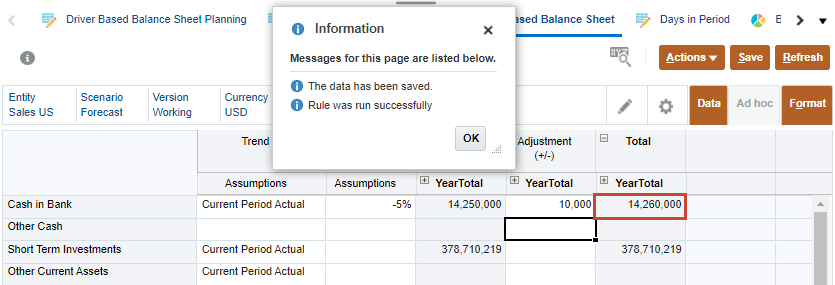
- Click OK to close the message.
- Select the Balance Sheet - Forecast tab. Notice that your plan data automatically flows into the preconfigured balance sheet, and the latest Year to Date values are automatically updated without having to modify the form.

You can also find the prior year and current year's data on this tab, as well as forecast and actual data.
Planning for direct entry accounts
For accounts which you cannot plan based on drivers or prior year, current year, or trend-based values, you can manually enter or edit data via direct entry. In this section, you directly adjust the estimate for Short Term Investments.
- In the Balance Sheet, notice that the balance for Short Term Investments is currently 378.7 million.

- On the left, click (
 ) Direct Entry.
You can optionally collapse the quarters for less scrolling.
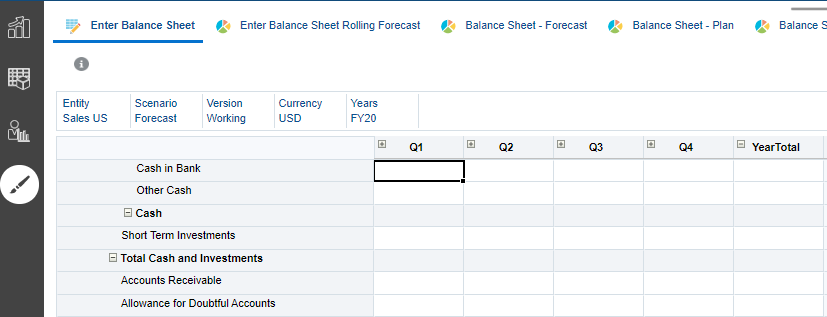
- For Short Term Investments, in the YearTotal column, enter 450k.

Notice that entering a balance for YearTotal automatically fills in the balance for the other periods.
- Click Save.
The form is automatically recalculated.

- Select the Balance Sheet - Forecast tab.
The value for Short Term Investments is now 379.1 million, based on your adjustment.

Planning cash flow
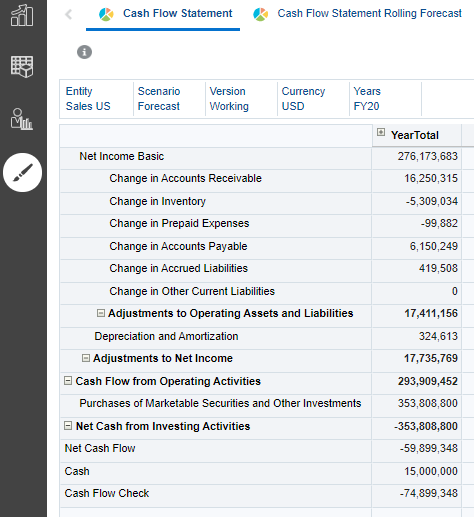
Cash flow in this business process is configured to be calculated indirectly from changes to non-cash accounts on the balance sheet and income statement.
In this section, you view the cash flow overview dashboard and cash flow statement, and you make direct entry adjustments to your derived cash flow.
- From the cards on the top of the page, click Cash Flow to see the Cash Flow overview dashboard.

- On the left, click (
 ) Direct Entry to view the Cash Flow Statement.
Cash flow reporting derives the cash flow based on changes to balance sheet accounts such as Accounts Receivable, Inventory, Accounts Payable, Depreciation, and Other Investments.
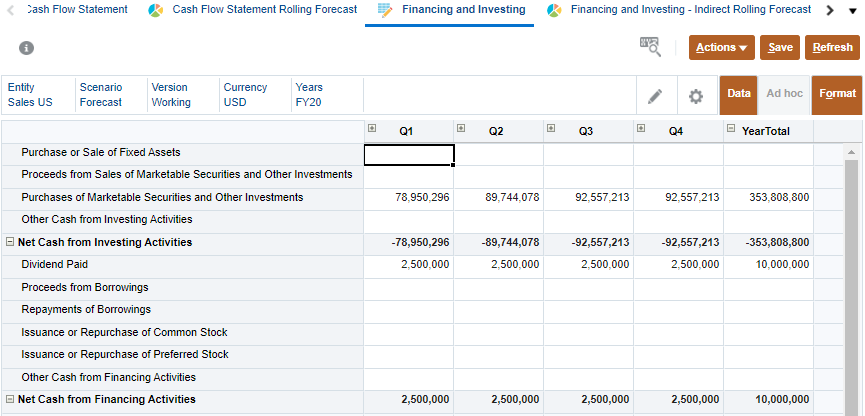
- Select the Financing and Investing tab. Here, you can enter information for accounts which are not derived.
You can optionally collapse the quarters for less scrolling.
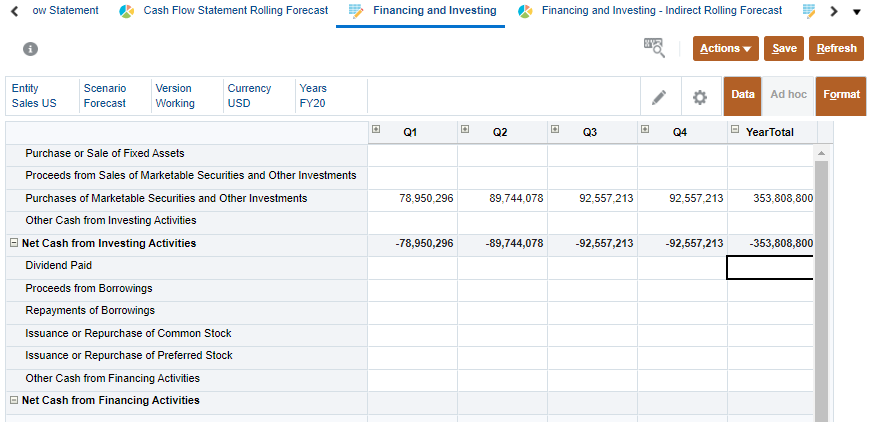
- For Dividend Paid, in the Year Total column, enter 10m. Notice that the value is automatically spread across the other time periods.
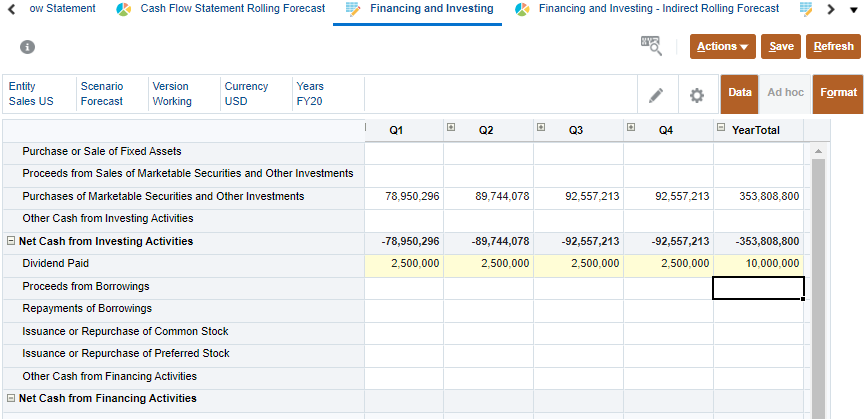
- Click Save to save and recalculate the form.
