Print
PrintBefore you begin
This 30-minute hands-on tutorial shows you how to perform trend-based planning in Financials. The sections build on each other and should be completed sequentially.
Background
Enhance your ability to manage and analyze finances at any business level using driver-based or trend-based income statement, balance sheet, and cash flow planning, or simply plan revenue and expenses. With the best practice, out of box drivers and accounts, Financials accelerates your planning process. You can also bring in your own chart of accounts while retaining the benefits of an integrated Financials framework.
With Financials, enter trend-based assumptions that let you plan and forecast based on trends. For example, you can plan by using current, projected, or past values (such as Forecast Average or Year Over Year Increase) and estimate the percent by which each value is likely to change.
You can readily spot trends because every period has the same number of weekdays and weekends. The retail business in particular benefits from this consistency across years. Forecast market trends, sales projections, interest rates, and inventory requirements using accurate historical information and key performance indicators. With trend-based planning, you can use measurable and verifiable data to plan effectively.
What do you need?
An EPM Cloud Service instance allows you to deploy and use one of the supported business processes. To deploy another business process, you must request another EPM Enterprise Cloud Service instance or remove the current business process.
- Have Service Administrator access to EPM Enterprise Cloud Service. The instance should not have a business process created.
- Upload and import this snapshot into your Planning instance.
For more information on uploading and importing migration snapshots, refer to the Administering Migration for Oracle Enterprise Performance Management Cloud documentation.
- Save this compressed file locally and extract the (csv) data files. You will be importing data using the extracted data files.
Trends in Financials
| Trends | Description |
|---|---|
| Current Year Actual Average | Calculates the average for an account for the current fiscal year specified in Planning and Forecast Preparation |
| Current Period Actual | Takes the value for an account for the month or week specified as the Current Period for the Current Fiscal Year specified in Planning and Forecast Preparation. |
| Hold Forecast to Current Year Plan | For the Forecast Scenario only, compares how much has been spent year to date for an account to the Plan for the current year, and spreads the remainder evenly over the remaining months in the Forecast. |
| Prior Year Actual Average | Calculates the average for an account for the year prior to the Current Fiscal Year specified in Planning and Forecast Preparation. |
| Prior Year Actual with Seasonality | Takes the value for accounts for the month using the value for the same month in the prior year. |
| Forecast Average | For the Plan Scenario only, takes the average for the Forecast from the prior year. |
| Forecast with Seasonality | For the Plan Scenario only, takes the monthly values from the Forecast from the prior year. |
| Year over Year Increase/Decrease | Applies a percent (%) increase or decrease to the prior year’s value. |
| Clear Trend | Removes the trend and clears the data from a previously set trend. |
| Monthly Growth | Calculates year over year change for an account using current year and prior year as the basis to calculate the growth. |
| Prior Month Run Rate | Takes the value of the prior period. |
Setting up the foundation for your plans and forecasts
In this section, you review the enabled features and time frame granularity, and set values for user variables in Financials.
Reviewing enabled features
In Enable Features, you select which parent key members, accounts, and drivers you want to enable for your Financials business process, as well as add and map custom dimensions. Based on your selections, dimensions, drivers, forms, and accounts are created.
You must define all custom dimensions the first time you enable features. You can’t define these later.
- On the Planning home page, click Application then Configure.
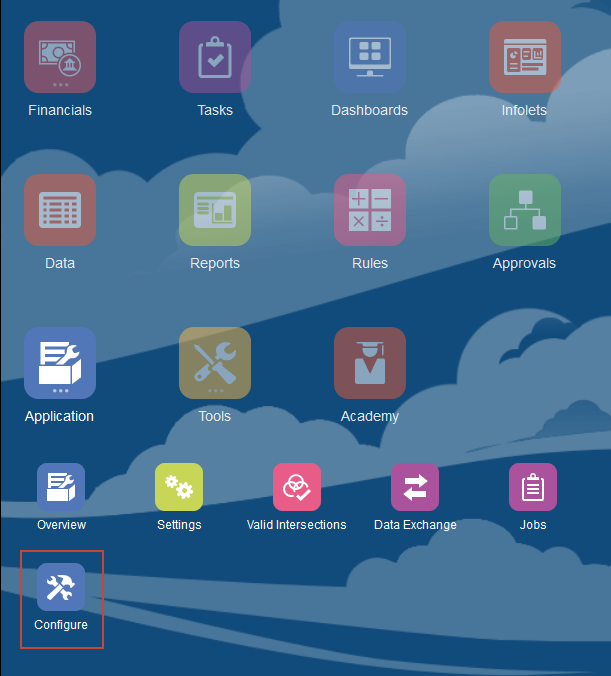
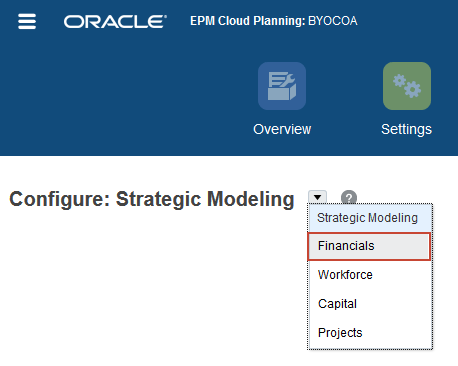
- From the Configure drop-down, select Financials.
- Click Enable Features.
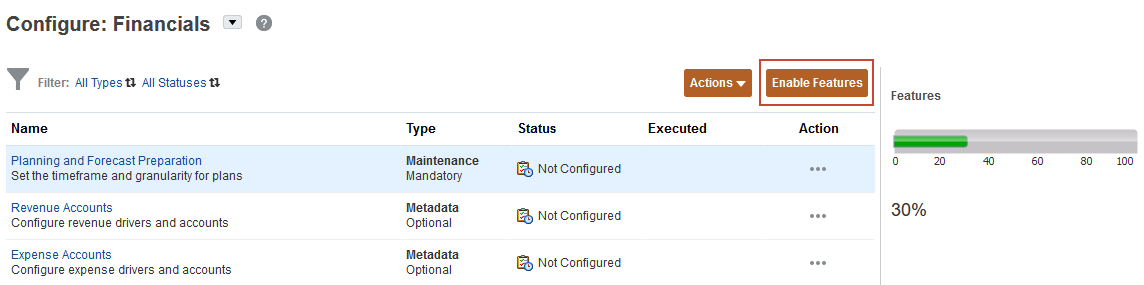
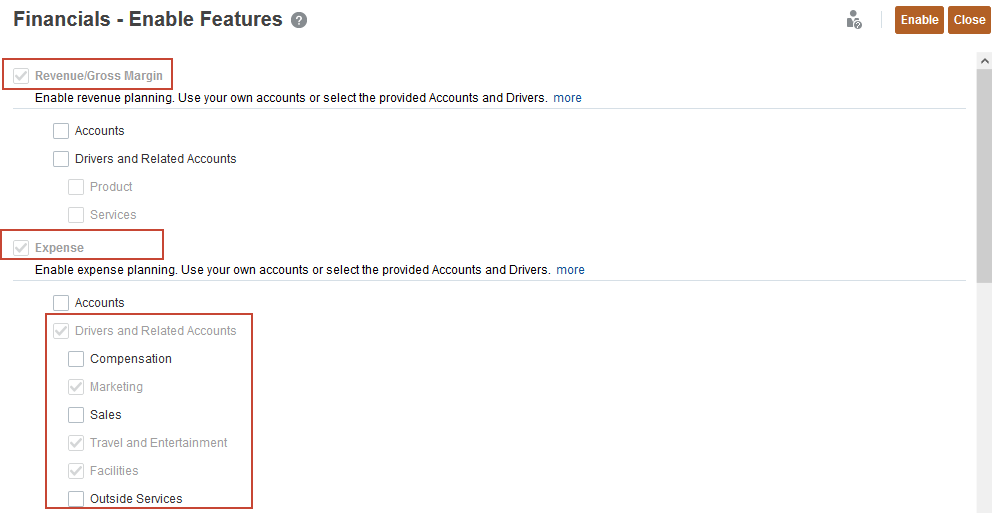
Revenue and Expense planning is enabled. Expenses are configured so that you can plan with drivers and related accounts.
- Scroll down.
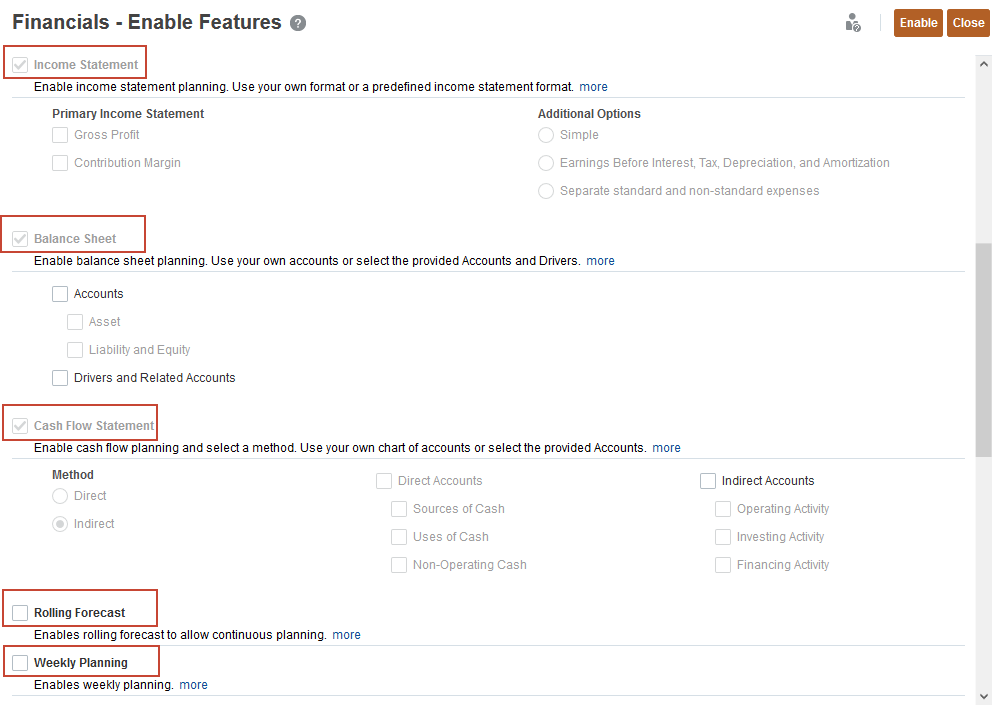
Income Statement, Balance Sheet and Cash Flow are configured. Currently, rolling forecast and weekly planning are not configured.
- Scroll down.
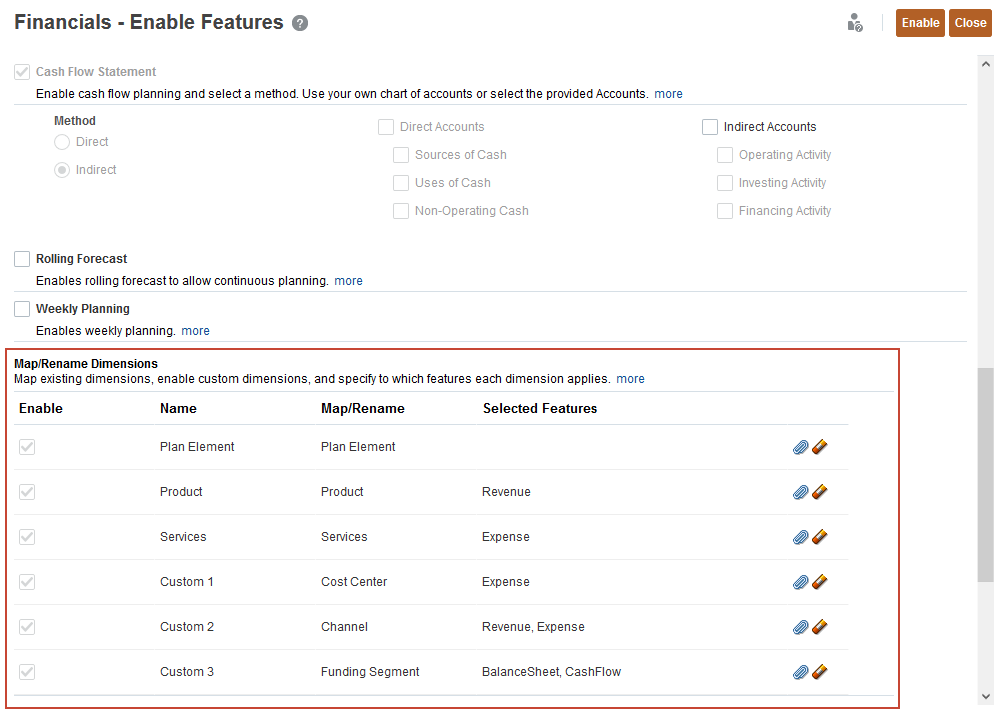
Existing dimensions and custom dimensions are displayed. Product dimension is enabled for Revenue and the Services dimension is enabled for Expense. Cost Center is enabled for Expense. Channel is enabled for both Revenue and Expense. Funding Segment is enabled for Balance Sheet and Cash Flow.
- Click Close.
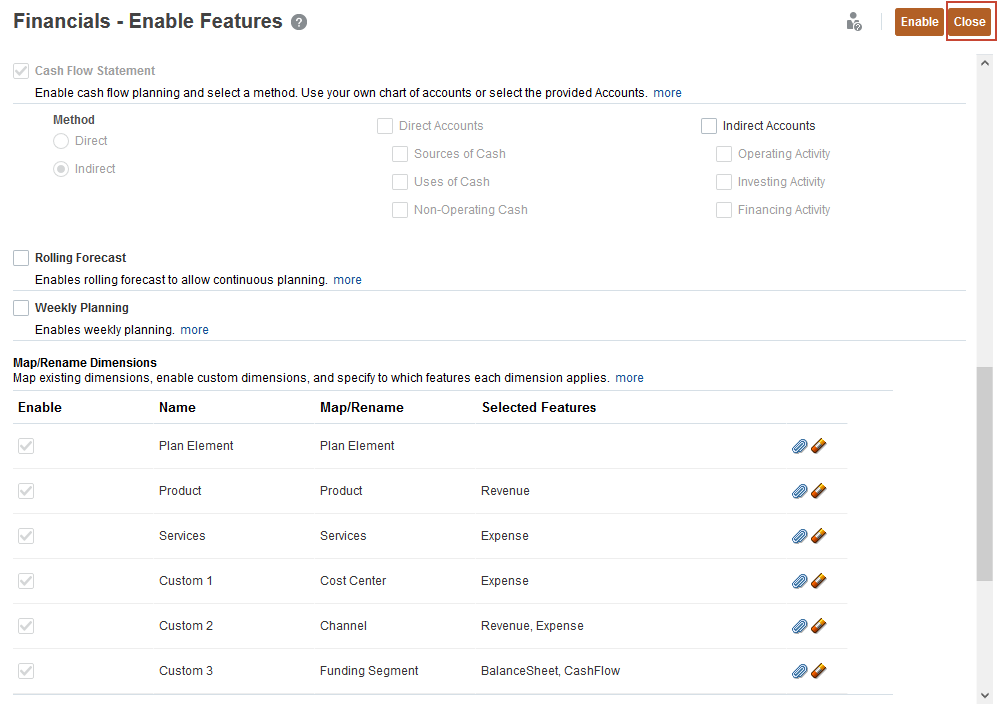
You can’t disable features later.
Reviewing time periods and granularity
In Planning and Forecast Preparation, you select the current fiscal year, period (month), and plan start year to control the beginning and end duration of your scenarios. You also set the period granularity for the Plan, Forecast, and Rolling Forecast (if enabled) scenarios in your business process.
- On Configure: Financials, click Planning and Forecast Preparation.
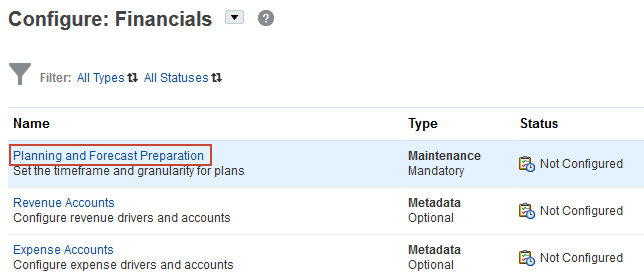
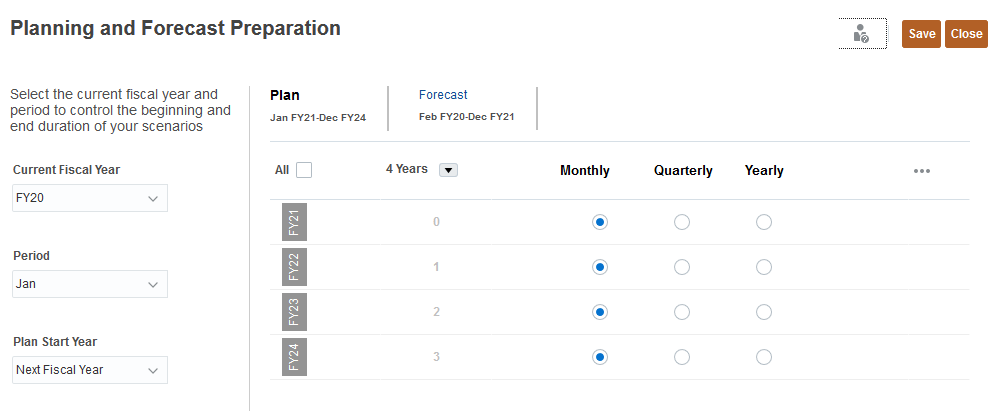
Notice the Current Fiscal Year is FY20, the Period is January, and the Plan Start Year is set to Next Fiscal Year.
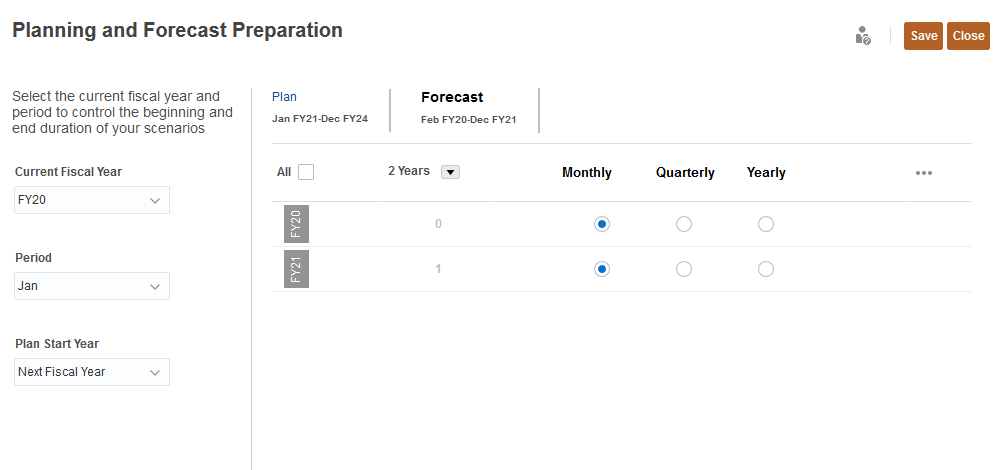
- Click Forecast.
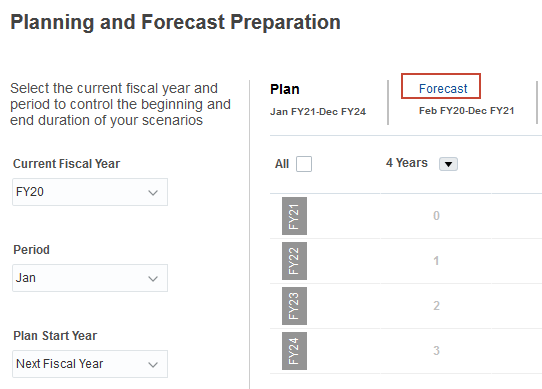
The Forecast starts in February FY20 and runs through December of FY21. The two year forecast is set on a monthly basis.
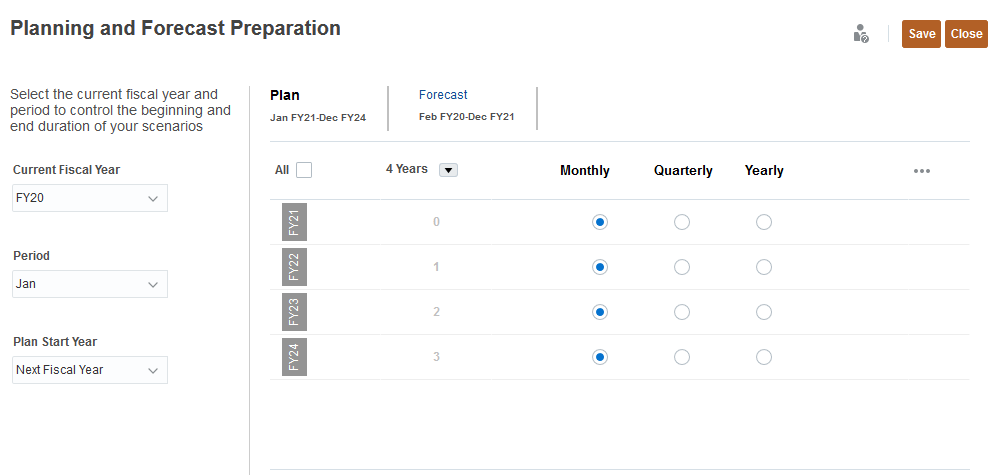
- Click Plan.
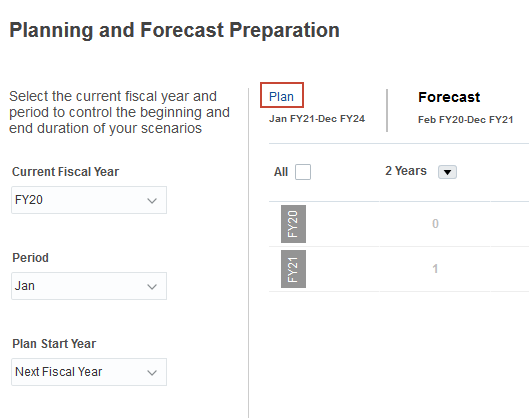
The four year Plan which runs from January FY21 through December of FY24, has each year's data planned on a monthly basis.
- Click Close.

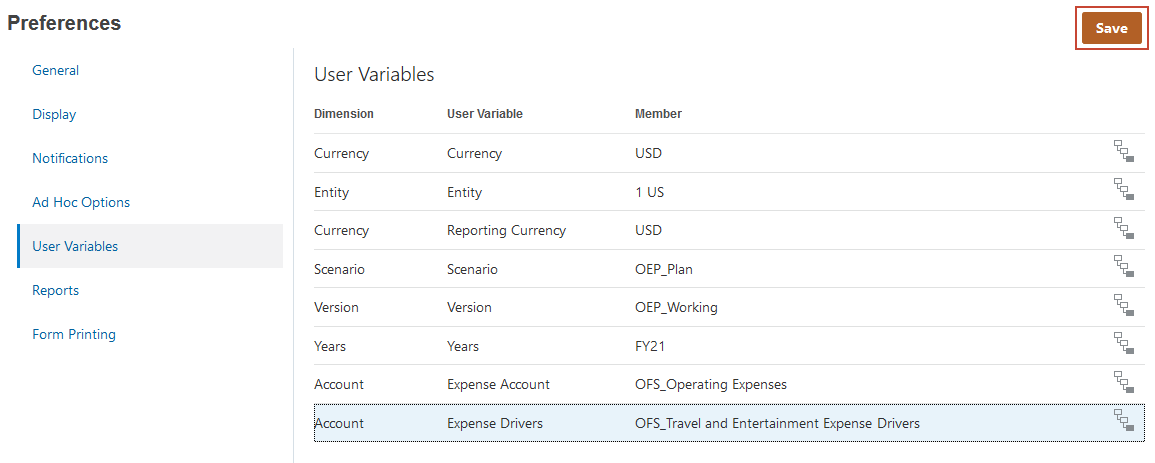
Selecting values for user variables
User Variables were added when the business process was created. User variables act as filters in forms, enabling planners to focus only on certain members. In this section, you set values for users values.
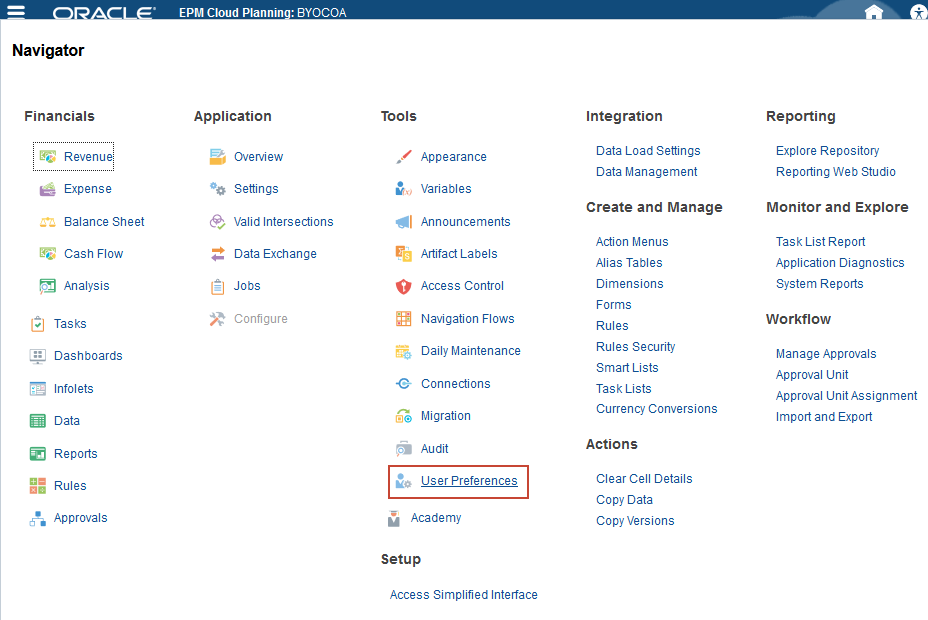
- Click
 (Navigator), and under Tools, select User Preferences.
- Click User Variables.
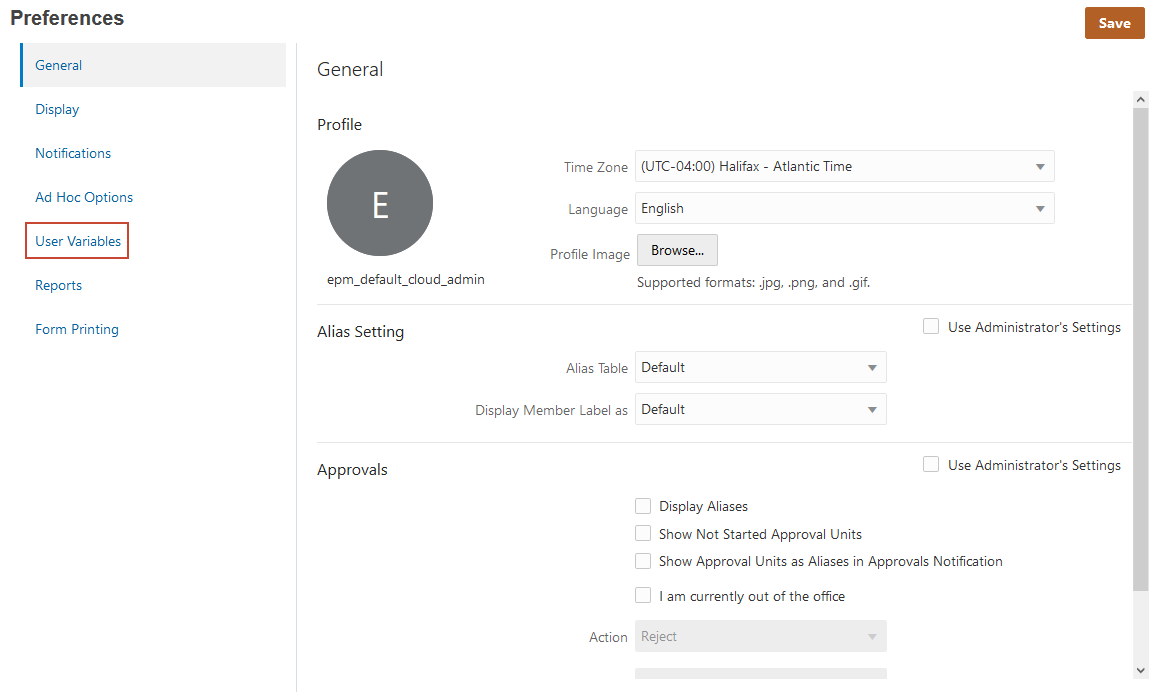
- For each variable click
 (Select Member) to set the variable's value as specified below:
- Currency: USD
- Entity: 1 US
- Reporting Currency: USD
- Scenario: OEP_Plan
- Version: OEP_Working
- Years: FY21
- Expense Account: OFS_Operating Expenses
- Expense Drivers:OFS_Travel and Entertainment Expense Drivers
- Click Save.
- At the information message, click OK.
- Click
 (Home).
Loading and calculating data
In this section, you load historical and plan data, calculate actual data, and roll up scenario data. You also review the loaded data.
Loading revenue and expense data
In this section, you load revenue and expense data to create a basis for your forecasts.
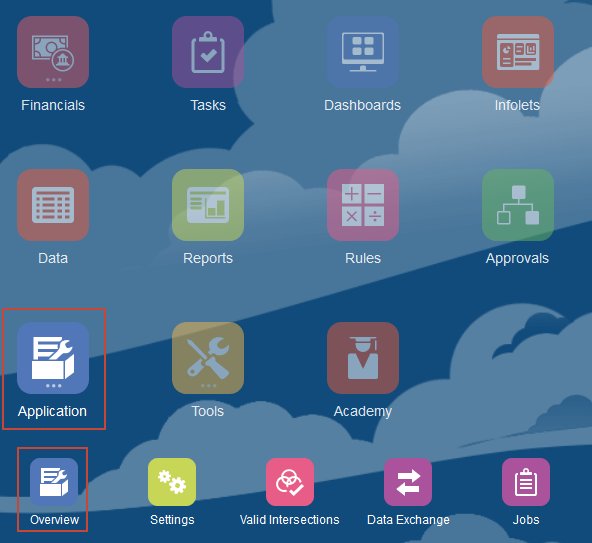
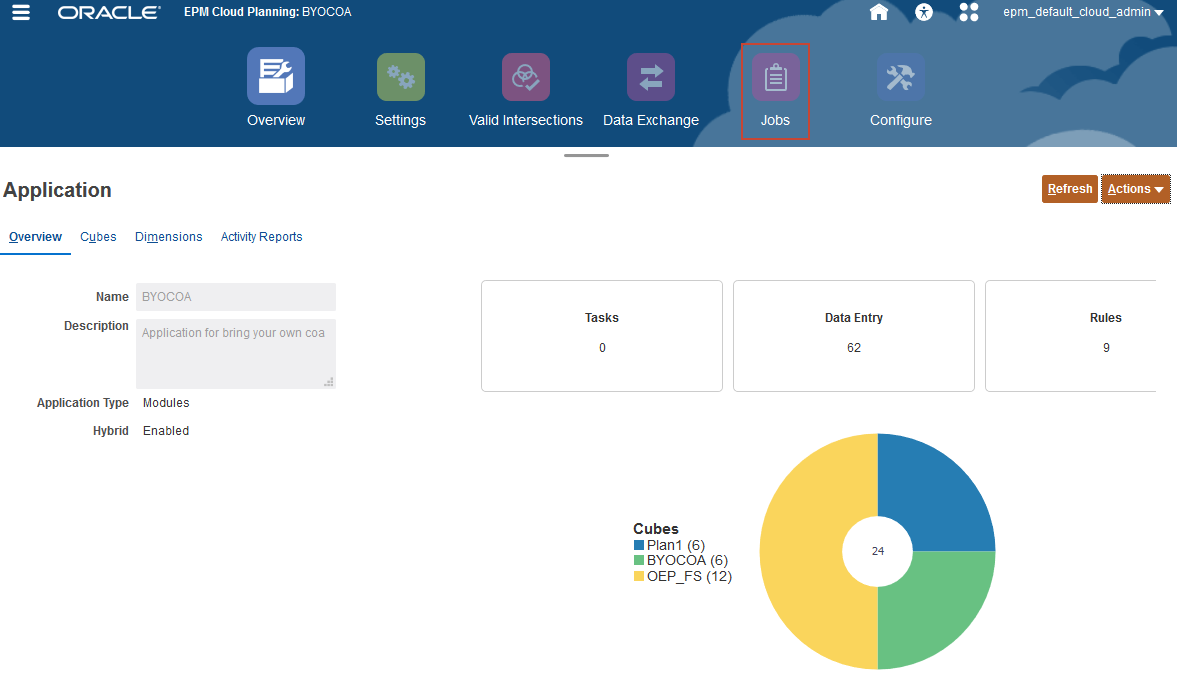
- On the Planning home page, click Application, then Overview.
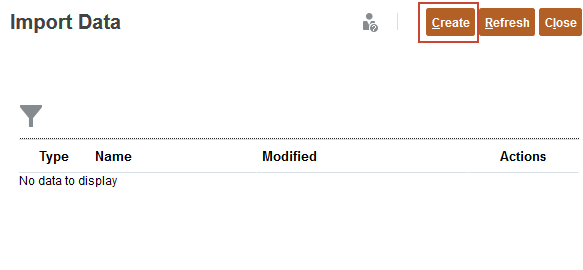
- On the Application page, click Actions, and select Import Data.
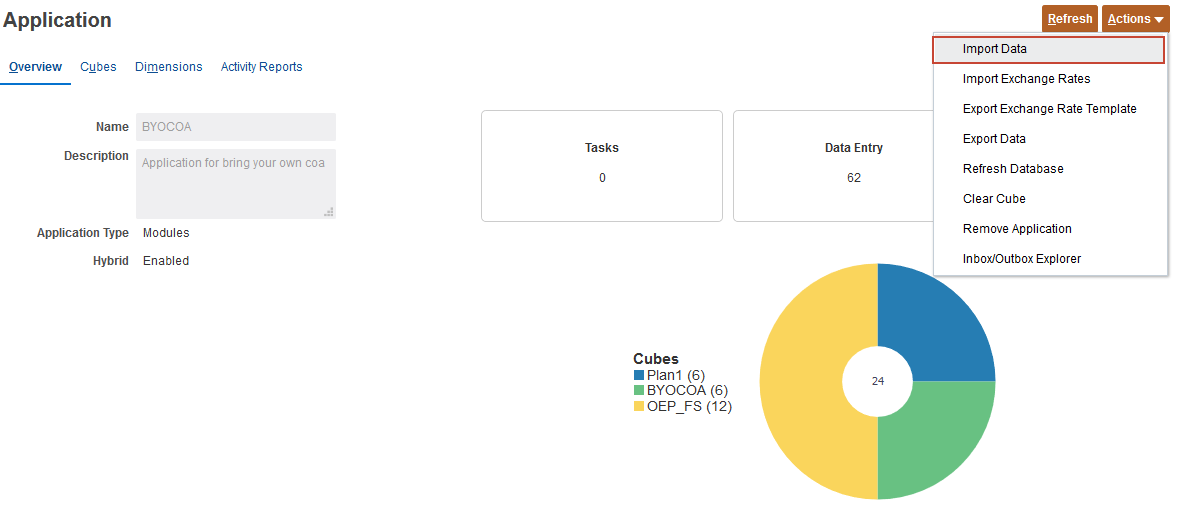
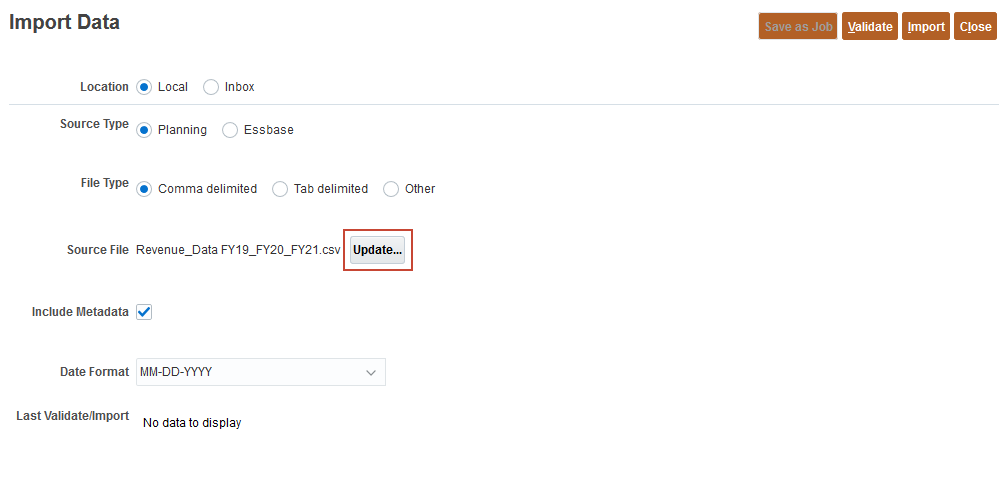
- In Import Data dialog, click Create.
- Keep all the default selections, and click Browse to select a file.
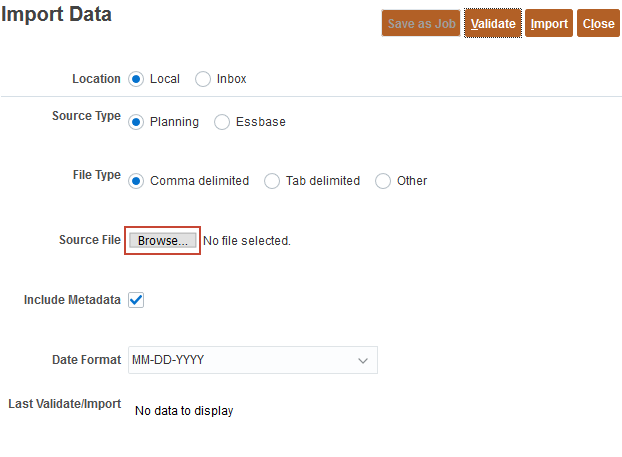
Depending on your browser, the button label may display Choose File or Browse.
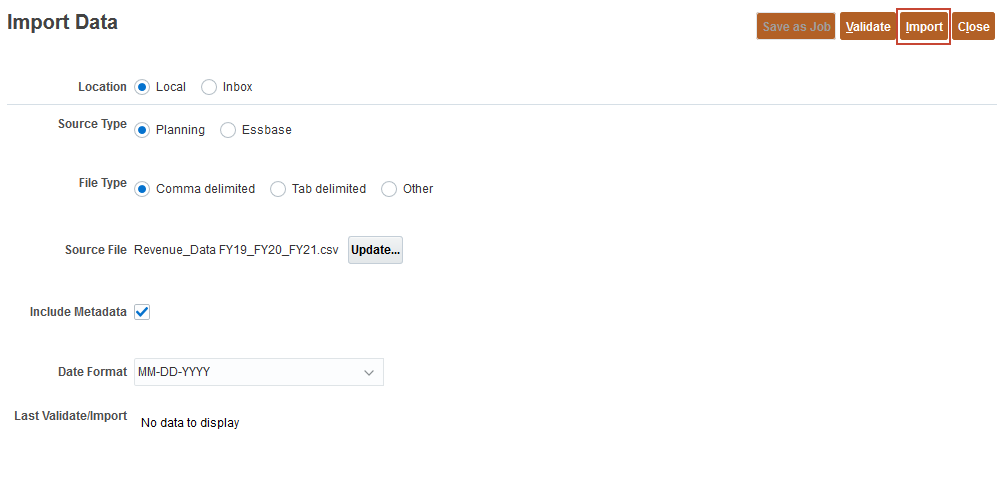
- Locate and select Revenue_Data FY19_FY20_FY21.csv, and click Open.
- Click Import.
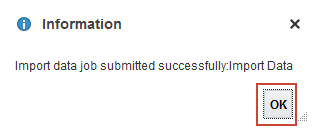
- At the information dialog, click OK.
The data files provided in this tutorial have been validated against the loaded business process. For newly created or modified data files, Oracle recommends that you validate the files before running the import process.
- In Import Data, click Update.
- Click Browse to select a file.
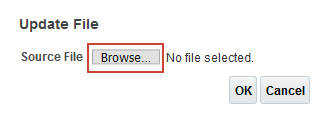
Depending on your browser, the button label may display Choose File or Browse.
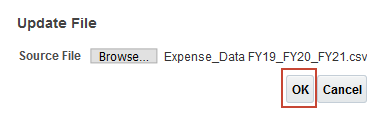
- Locate and select Expense_Data FY19_FY20_FY21.csv, and click Open.
- In Update File, click OK.
- Click Import.
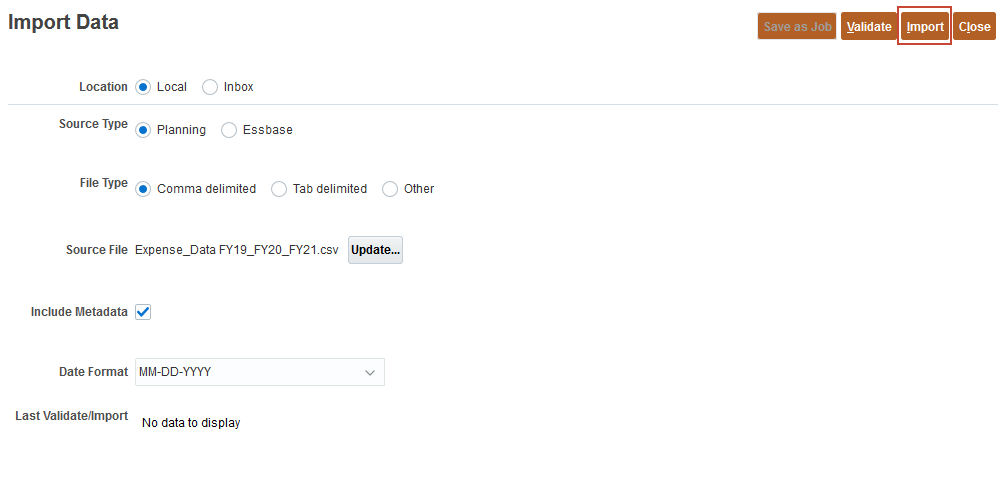
- At the information dialog, click OK.
- Click Close twice.
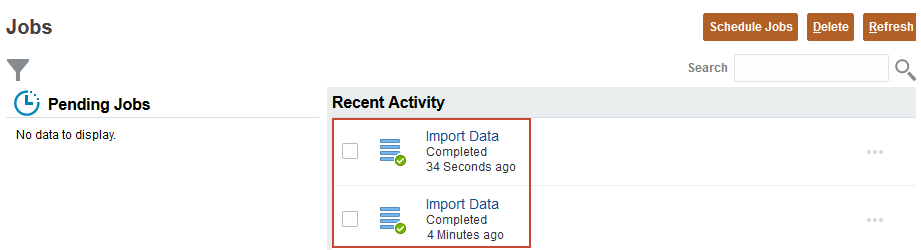
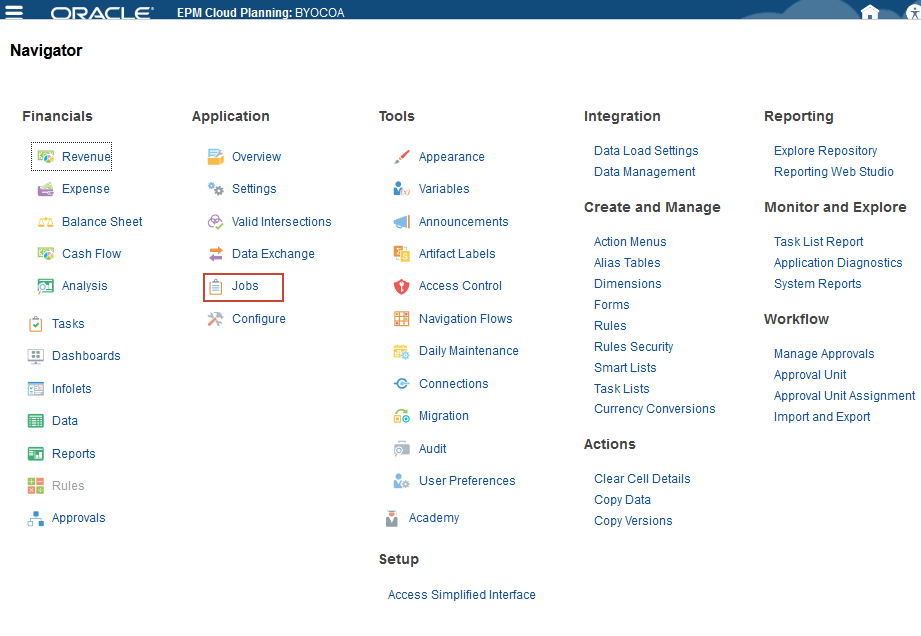
- Click Jobs.
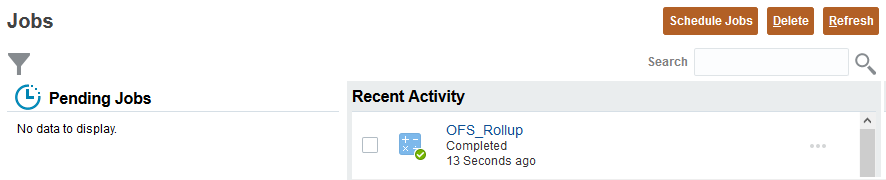
- Verify that the jobs completed successfully.
- Click (Home).
Calculating actuals
In this section, you calculate actual data to calculate drivers and aggregate data. After loading data, you run this rule to ensure that you're working with the latest figures and calculations.
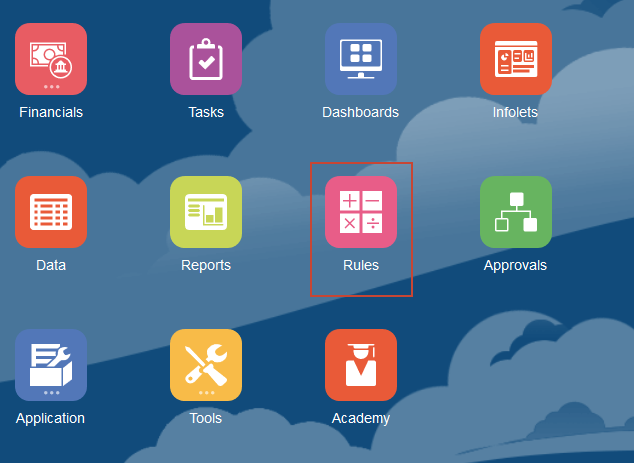
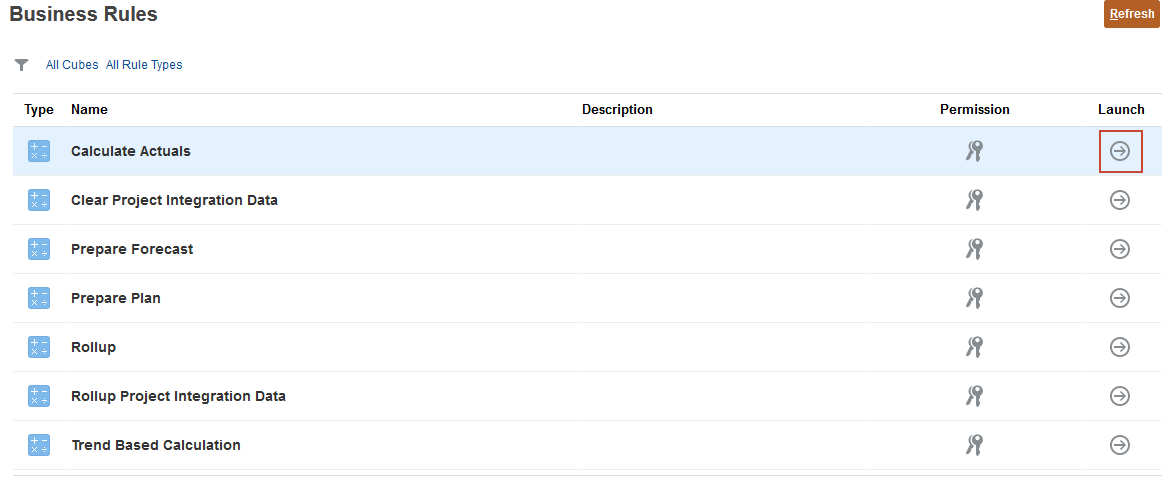
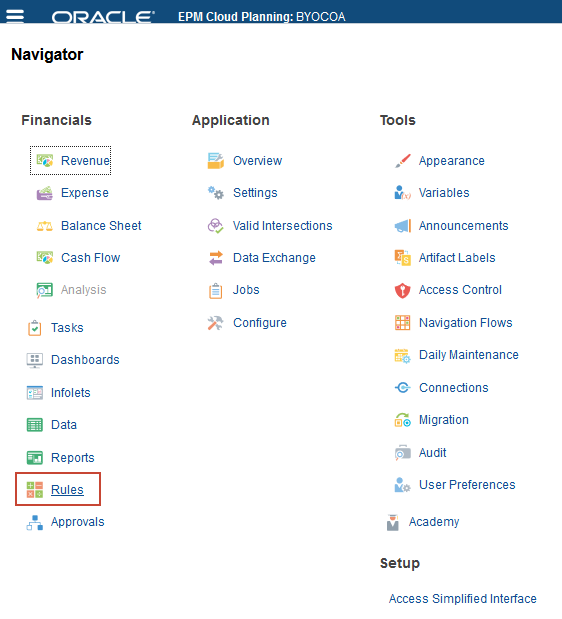
- From the Planning home page, click Rules.
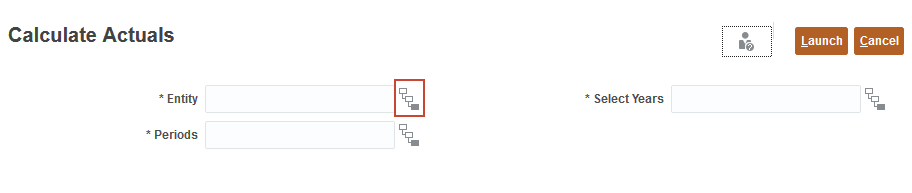
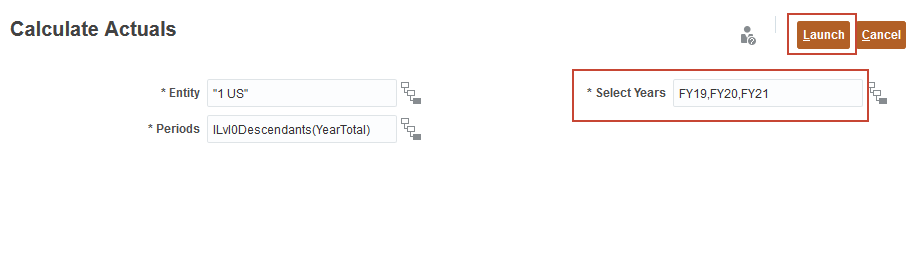
- On Business Rules, for the Calculate Actuals row, click Launch.
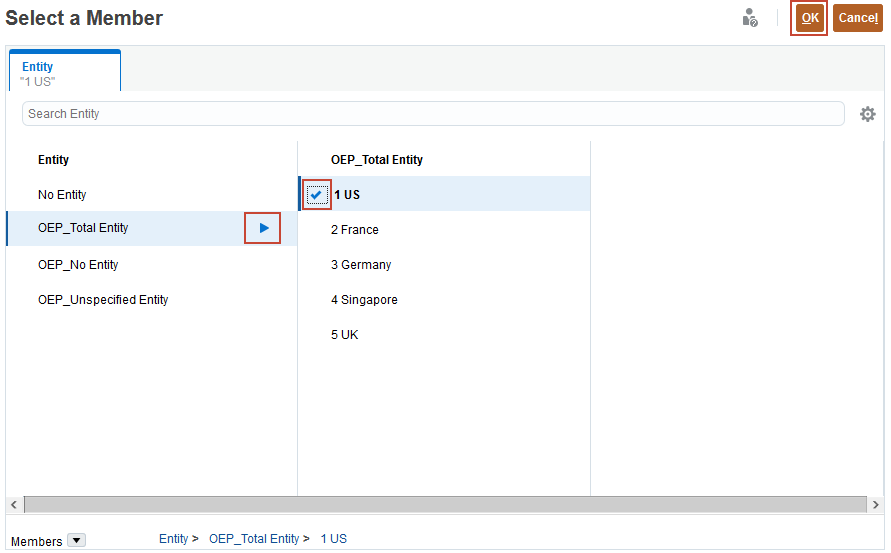
- For Entity, click (Select Member).
- Click the arrow to the right of OEP_Total Entity, and select 1 US, and click OK.
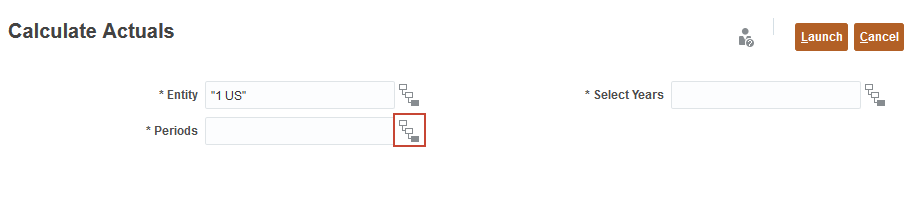
- For Periods, click (Select Member).
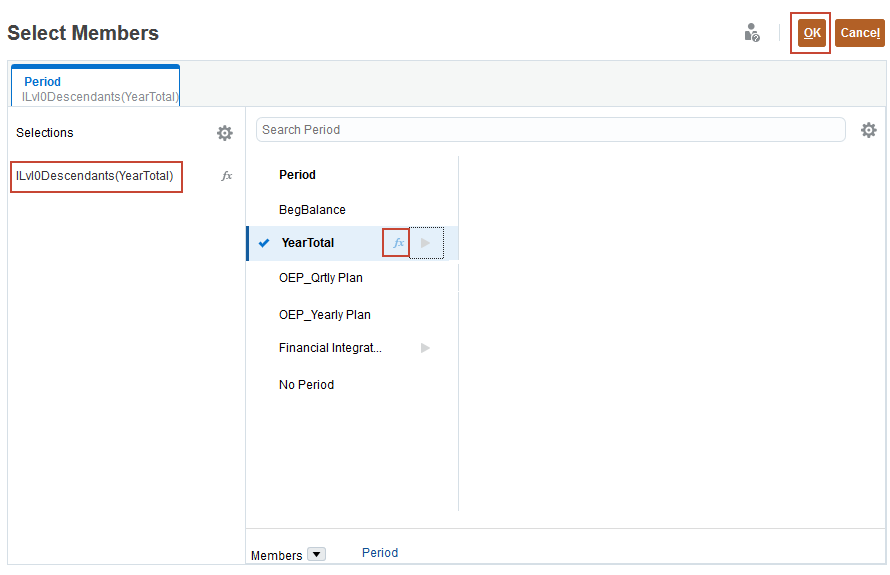
- For YearTotal, click
 (Function Selector), select Level 0 Descendants, and click OK.
- For Select Years, enter FY19,FY20,FY21and click Launch.
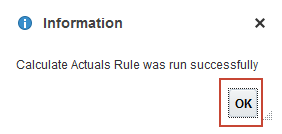
- At the Information dialog, click OK.
- Click (home).
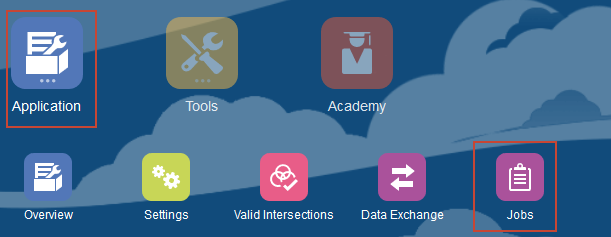
- From the Planning Home page, click Application then Jobs.
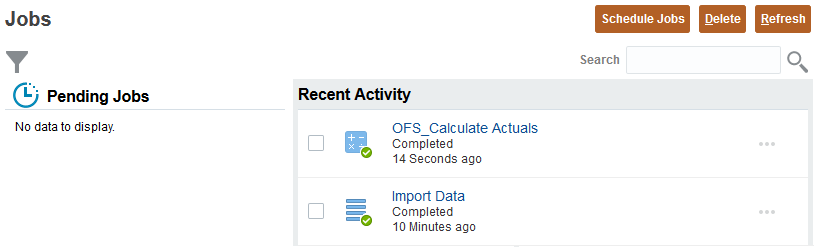
- Verify that the job completed successfully.
- Click (Home).
Rolling up data for scenarios
In this section, you run a rule to rollup the loaded data.
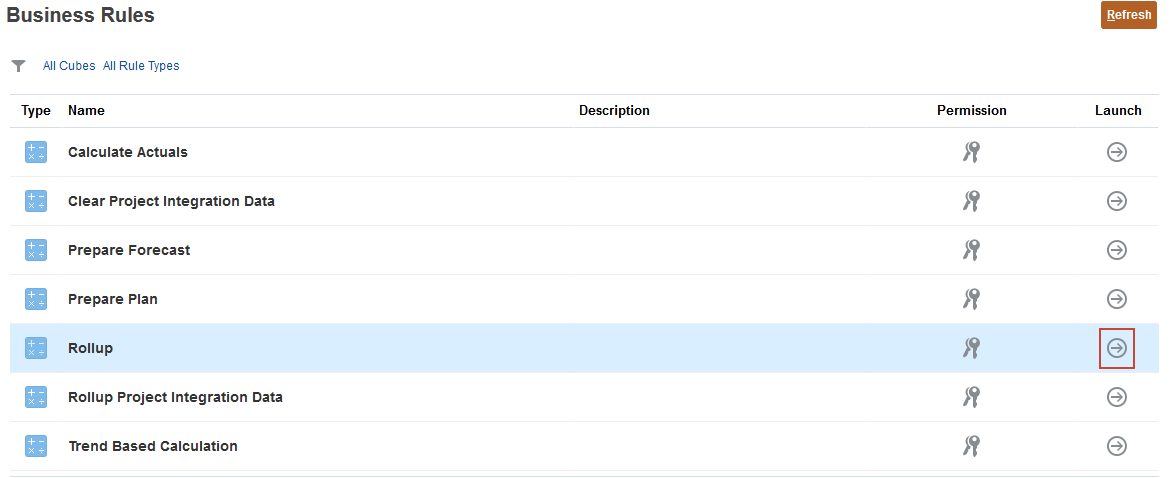
- On the Planning home page, click Rules.
- For Rollup, on the right, click Launch.
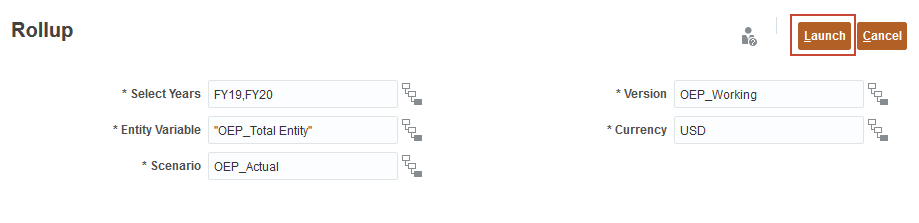
- For Scenario, select OEP_Actual. Then for each member click (Select Member) to set the value as specified below, and click Launch:
- Years: FY19,FY20
- Currency: USD
Change the value of the scenario dimension first.
- At the information message, click OK.
- Click Navigator, and under Application, select Jobs.
The rollup job completed successfully.
- Click (Home).
Reviewing loaded data
In this section, you verify that actual data was loaded.
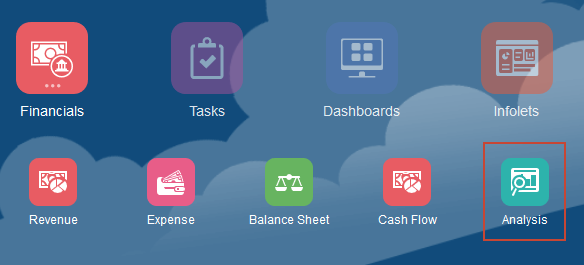
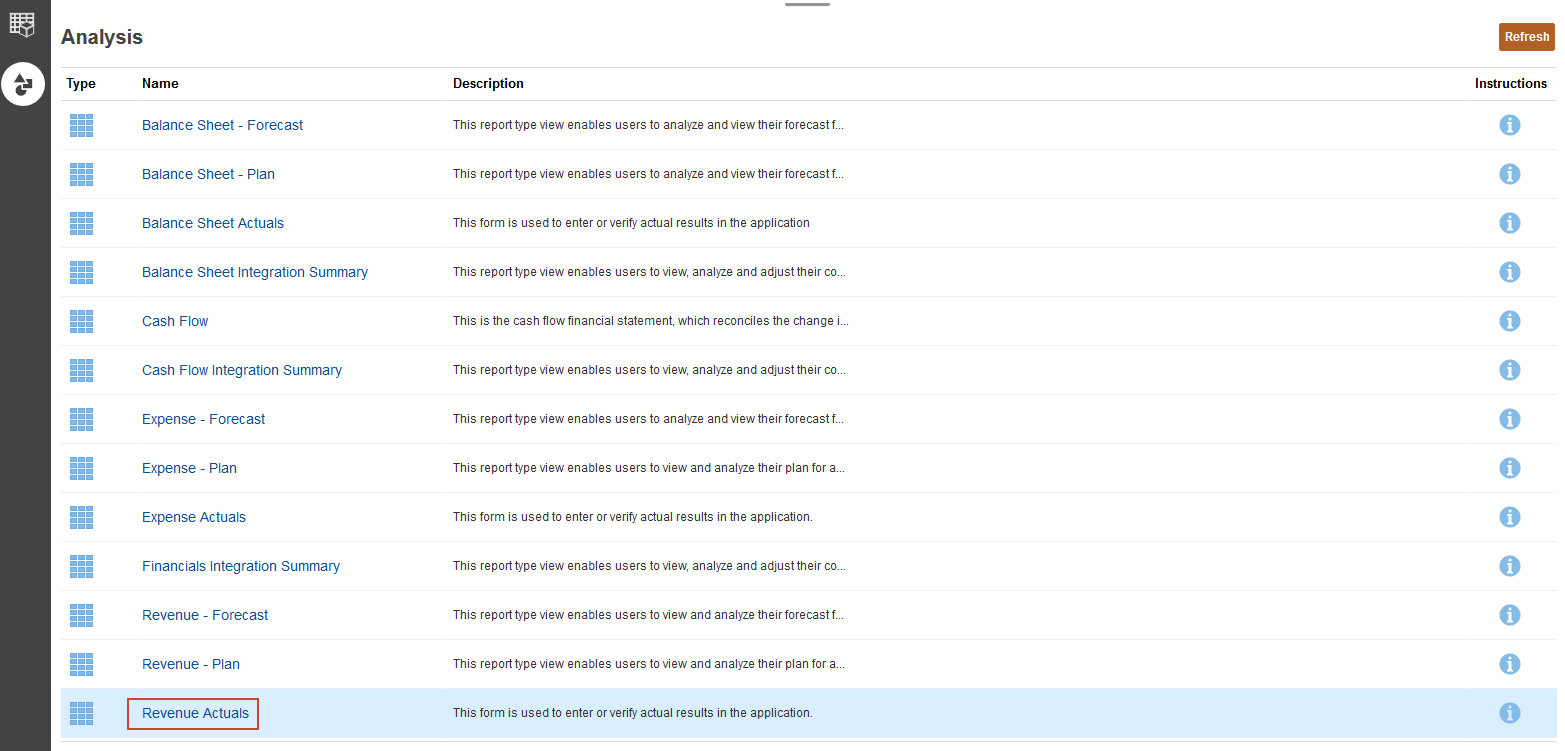
- On the Planning home page, click Financials, then Analysis.
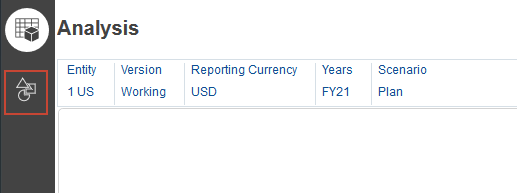
- Select the Forms vertical tab.
- Click Revenue Actuals.
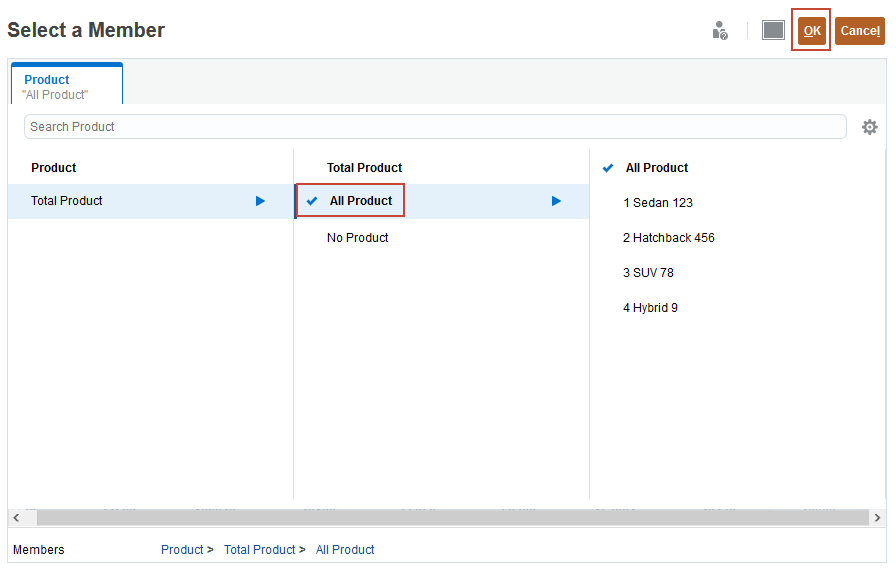
- Click Product, select All Product, and click OK.
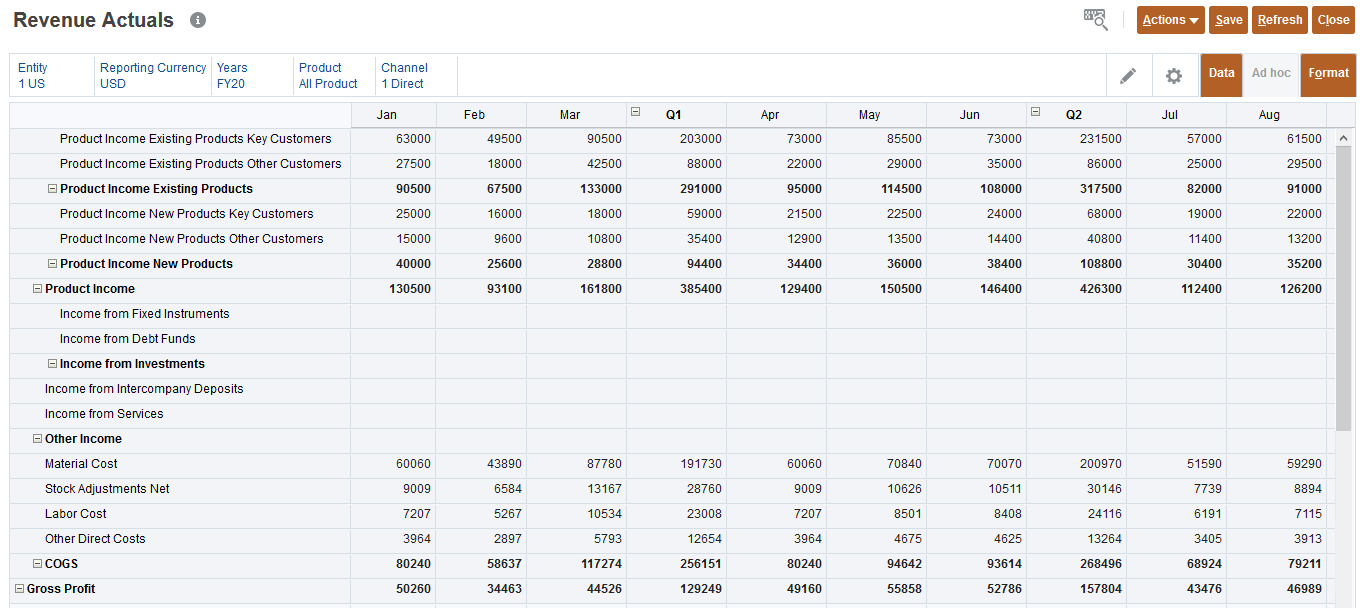
- Ensure the POV is set to the following and click
 (Go).
(Go).

The loaded revenue data is displayed.
- Click Close.
Preparing plans and forecasts
In this section, you run business rules to update plans and forecasts.
Preparing plans
In this section you calculate all driver and trend based data for the selected plan years. Typically, you run Prepare Plan to create a new year plan as years change, or you can use it if you have prepared a multi-year plan and have updated data for trend and driver basis.
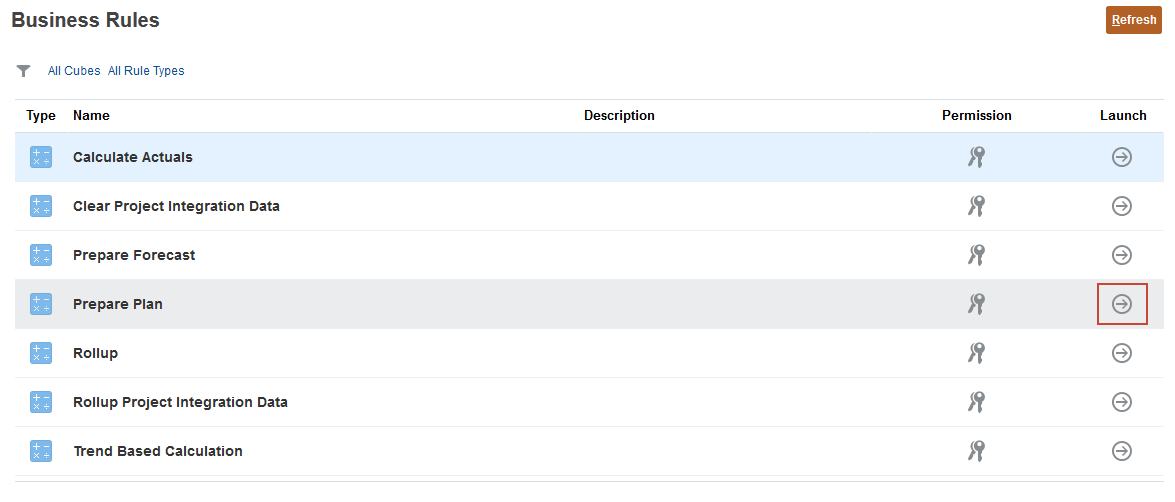
- Click (Navigator), and under Financials, click Rules.
- In the Prepare Plan row, click
 (Launch).
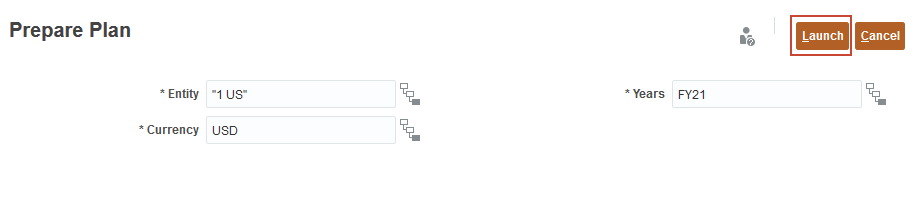
- For each member, click (Select Member) to set the value as specified below, then click Launch:
- Entity: "1 US"
- Currency: USD
- Years: FY21
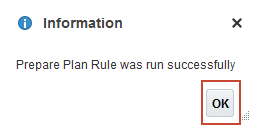
- At the Information message, click OK.
Preparing forecasts
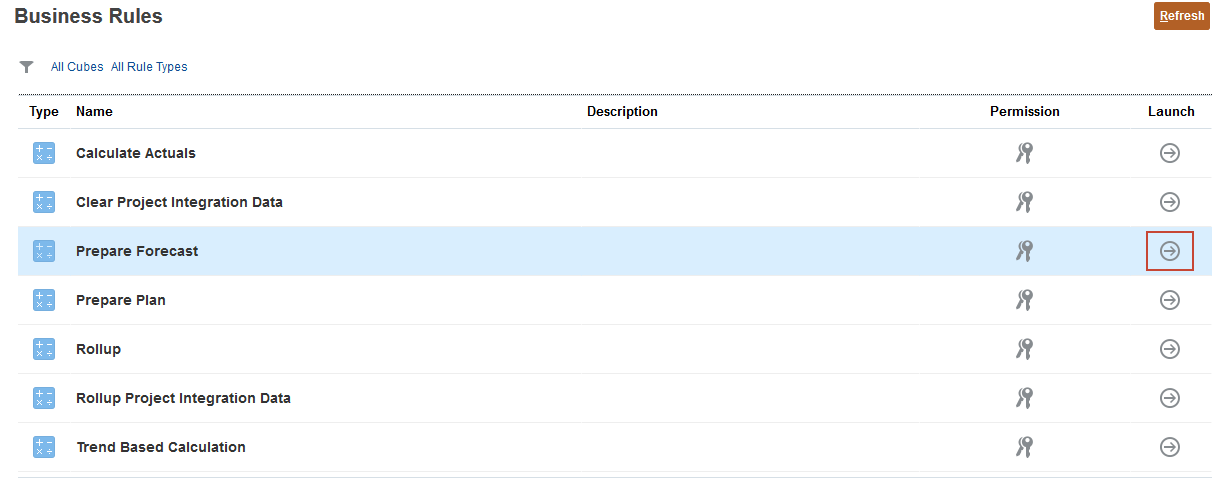
In this section, you run the Prepare Forecast rule to copy selected months from the Actual scenario to the Forecast scenario. The rule also recalculates drivers and trends based on actual results. This rule also copies current forecast to the prior forecast version for comparison. You can use this rule when rolling over to a new year as the starting point for a forecast.
- On Business Rules, for the Prepare Forecast row, click (Launch).
- For each member click (Select Member) to set the value as specified below, then click Launch:
- Entity: "OEP_Total Entity"
- Actual Months: Jan
- Currency: USD
- Years: FY21

- At the Information message, click OK.
- Click (Home).
Planning using trends
You can plan revenue based on trends and increase or decrease those values to calculate plan data.
Basing plans on actual data
With trends, you can develop your plans by basing them on loaded actual data.
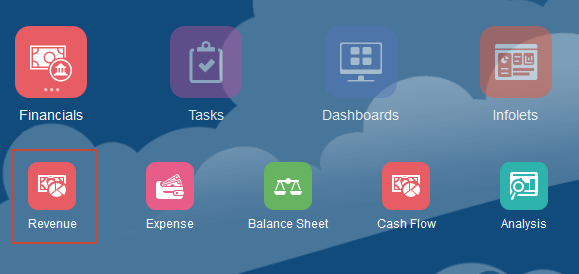
- On the Planning home page, click Financials then Revenue.
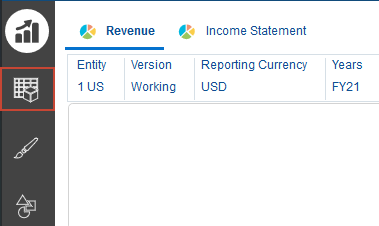
- On the left, select the Driver and Trend Based vertical tab.
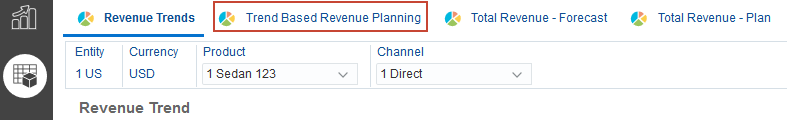
- Select the Trend Based Revenue Planning horizontal tab.
- Make POV selections based on the following, and click
 (Go):
(Go):

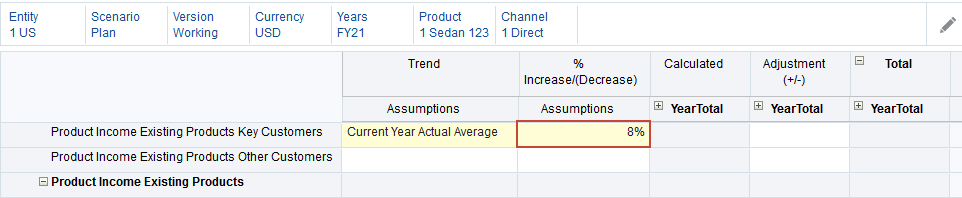
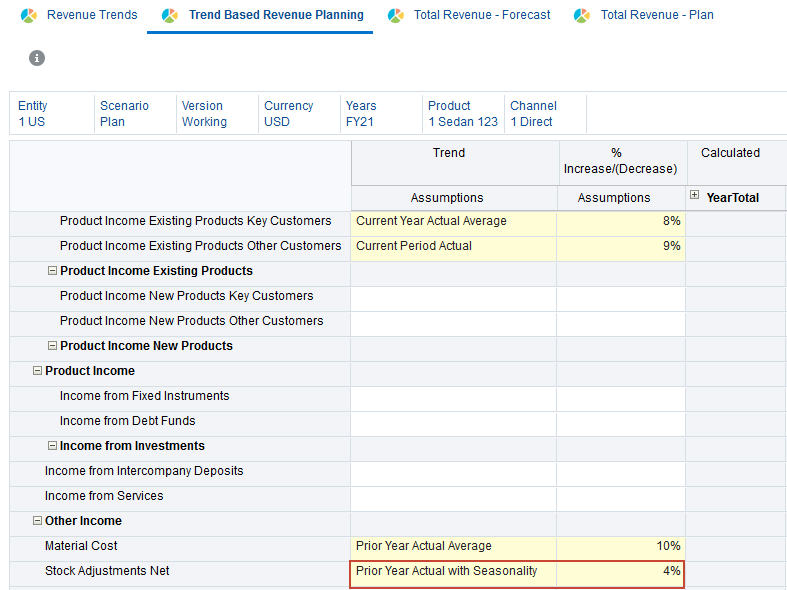
- For Product Income Existing Products Key Customers, in Trend Assumptions, select Current Year Actual Average.
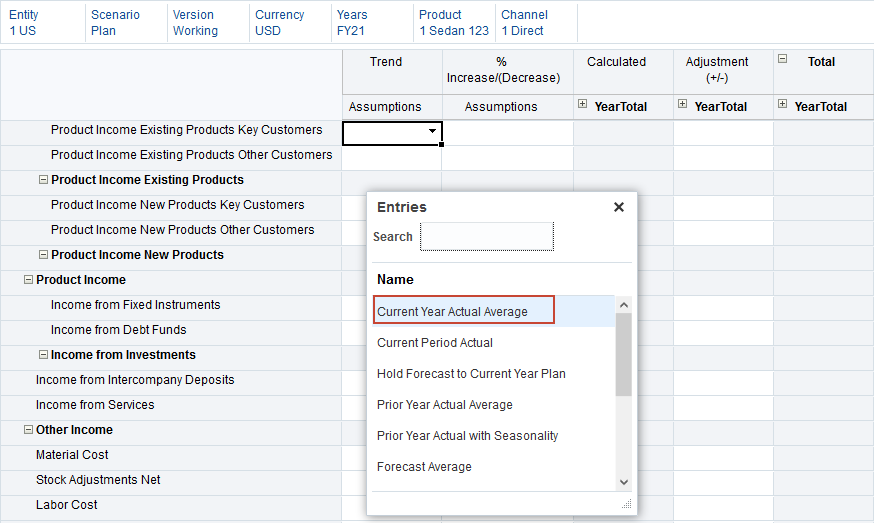
Current Year Actual Average calculates the average for an account for the current fiscal year specified in Planning and Forecast Preparation. The current fiscal year, is FY20 and has actual data loaded.
- For Product Income Existing Products Key Customers, in %Increase/(Decrease), enter 8%.
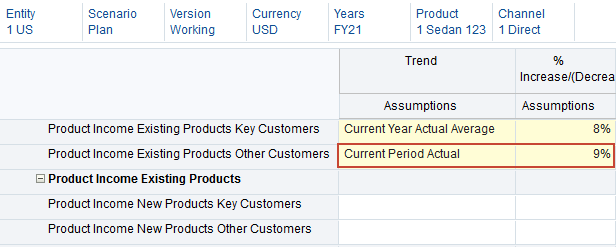
- For Product Income Existing Products Other Customers, in Trend Assumptions, select Current Period Actual, and for Product Income Existing Products Other Customers, in %Increase/(Decrease), enter 9%.
Current Period Actual takes the value for an account for the month or week specified as the Current Period for the Current Fiscal Year specified in Planning and Forecast Preparation. The current period is January and the current fiscal year is FY20 and has actual data loaded.
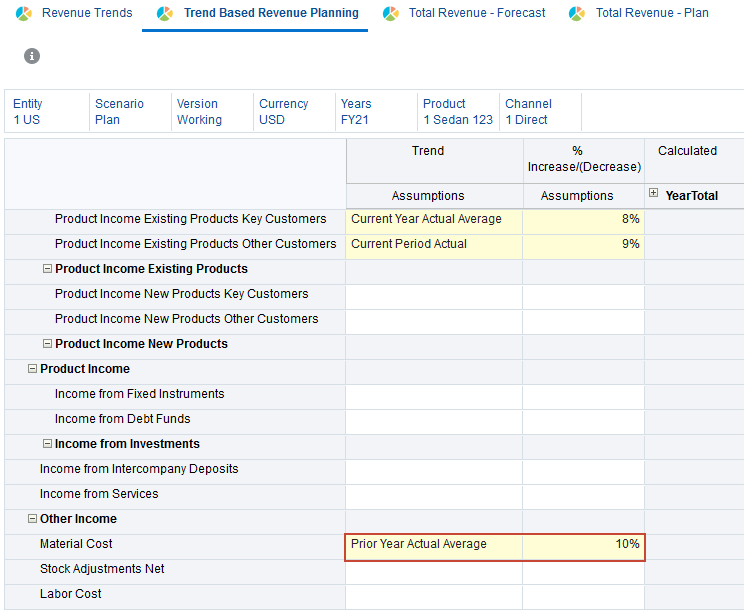
- For Material Cost, in Trend Assumptions, select Prior Year Actual Average, and in %Increase/(Decrease), enter 10%.
Prior Year Actual Average calculates the average for an account for the year prior to the Current Fiscal Year specified in Planning and Forecast Preparation. The current period is January and the current fiscal year is FY20 so the prior year prior is FY19.
- For Stock Adjustments Net, in Trend Assumptions, select Prior Year Actual with Seasonality, and for Stock Adjustments Net, in %Increase/(Decrease), enter 4%.
Prior Year Actual with Seasonality calculates the value for accounts for the month using the value for the same month in the prior year. The current fiscal year is FY20 so the year prior is FY19. To calculate monthly data using this trend, the monthly data from FY19 is used.
- Click Save.
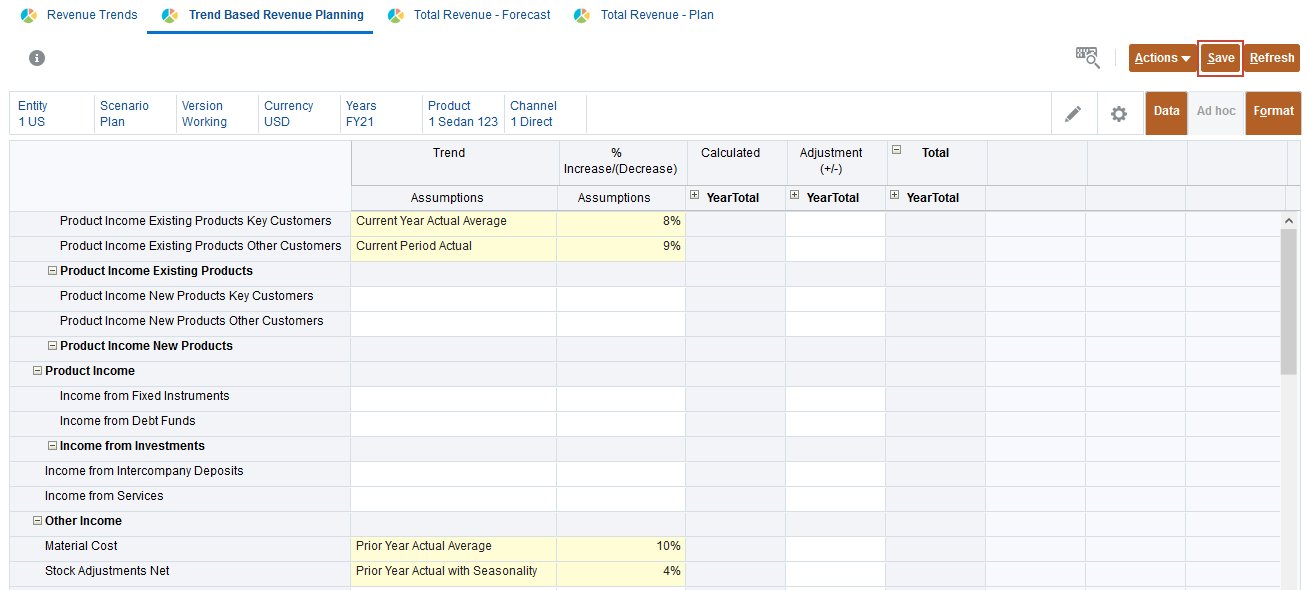
- At the Information message, click OK.
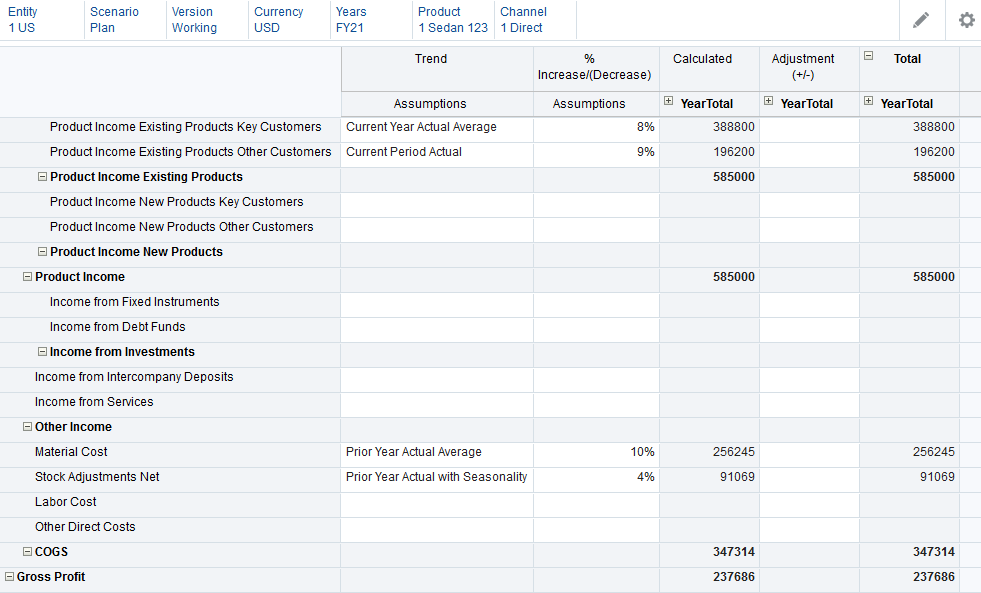
The data is calculated based on the selections.
Planning data based on trends
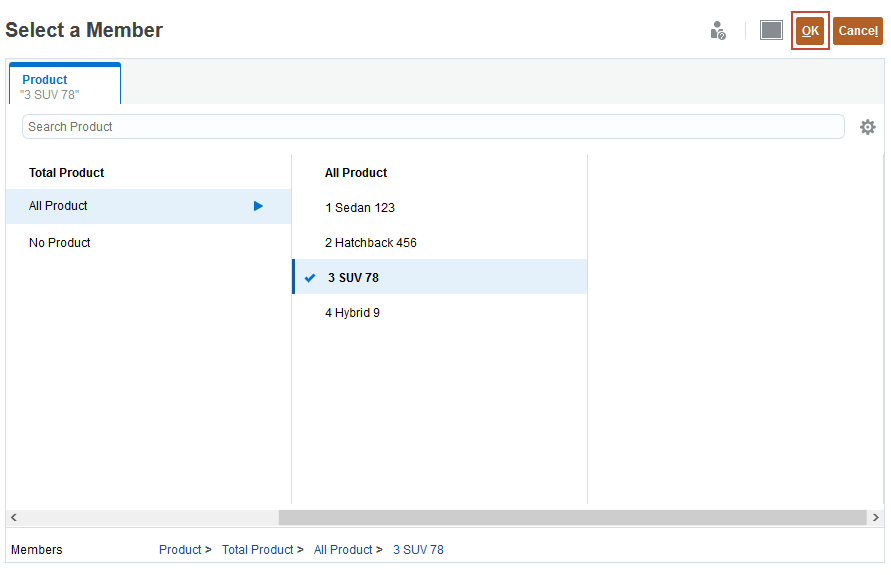
- Click Product and change the product to 3 SUV 78, and click OK.
- Click (Go).
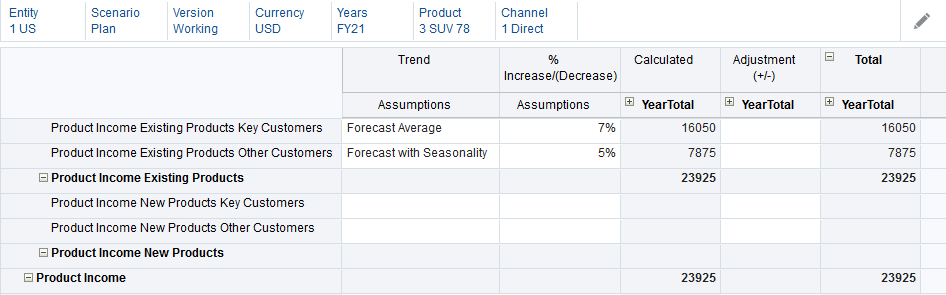
- For Product Income Existing Products Key Customers, in Trend Assumptions, select Forecast Average and in %Increase/(Decrease), enter 7%.
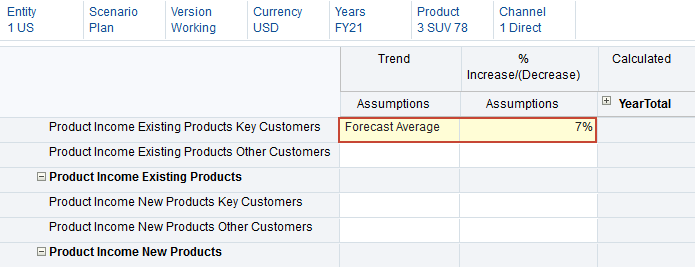
Forecast average is valid only for the Plan Scenario, and takes the average for the Forecast from the prior year. The prior year is FY20.
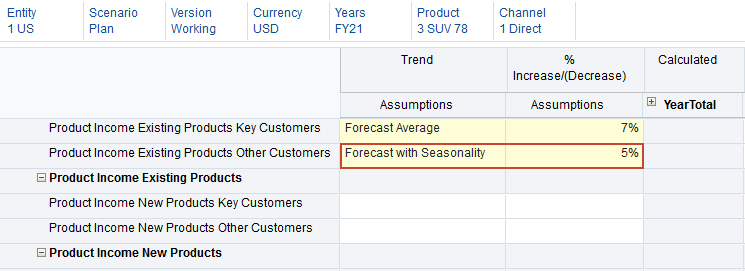
- For Product Income Existing Products Other Customers, in Trend Assumptions, select Forecast with Seasonality, and in %Increase/(Decrease), enter 5%.
Forecast with Seasonality is for the Plan Scenario only, and takes the monthly values from the Forecast from the prior year, FY20.
- Click Save.
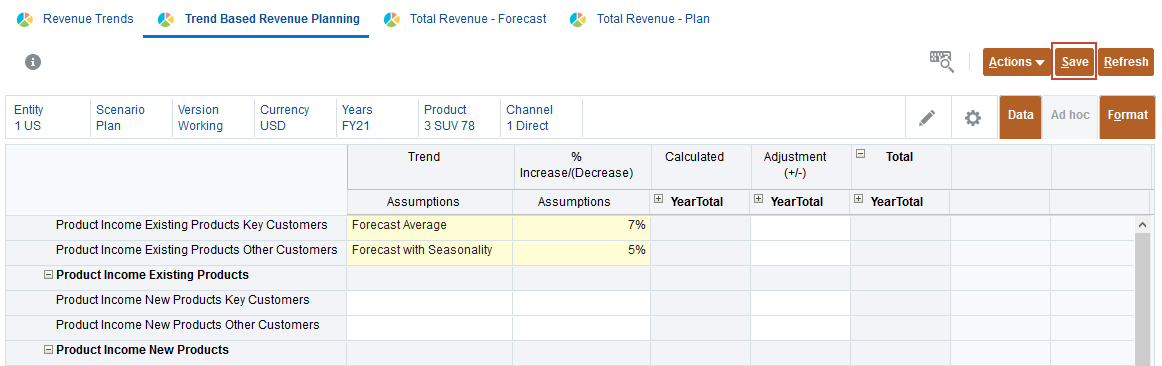
- At the Information message, click OK.
The data is calculated based on the selections.
- Click Product and change the product to 2 Hatchback 456, and click OK.
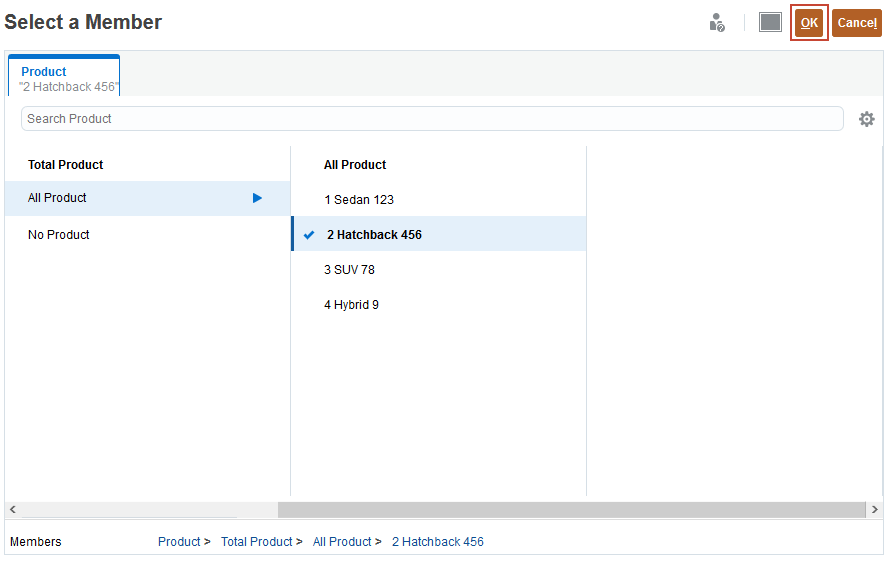
- Click (Go).
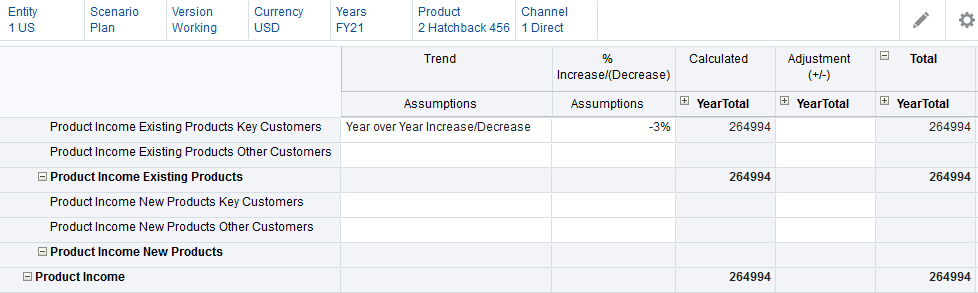
- For Product Income Existing Products Key Customers, in Trend Assumptions, select Year over Year Increase/Decrease and in %Increase/(Decrease), enter -3%.
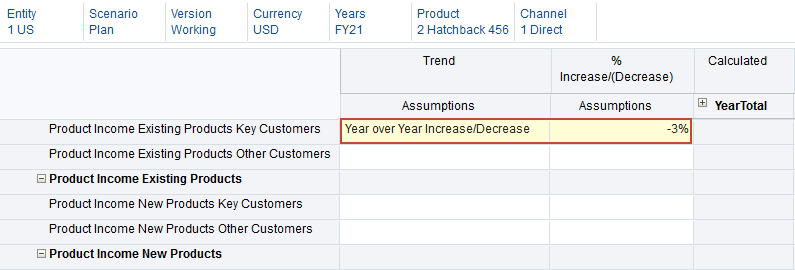
Year over Year Increase/Decrease applies a percentage increase or decrease to the prior year’s value. You need to have data for the prior year, in this case FY20.
- Click Save.
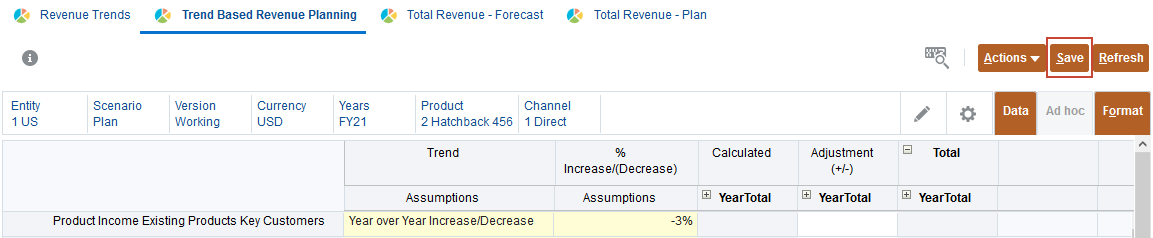
- At the Information message, click OK.
The data is calculated based on the selections.
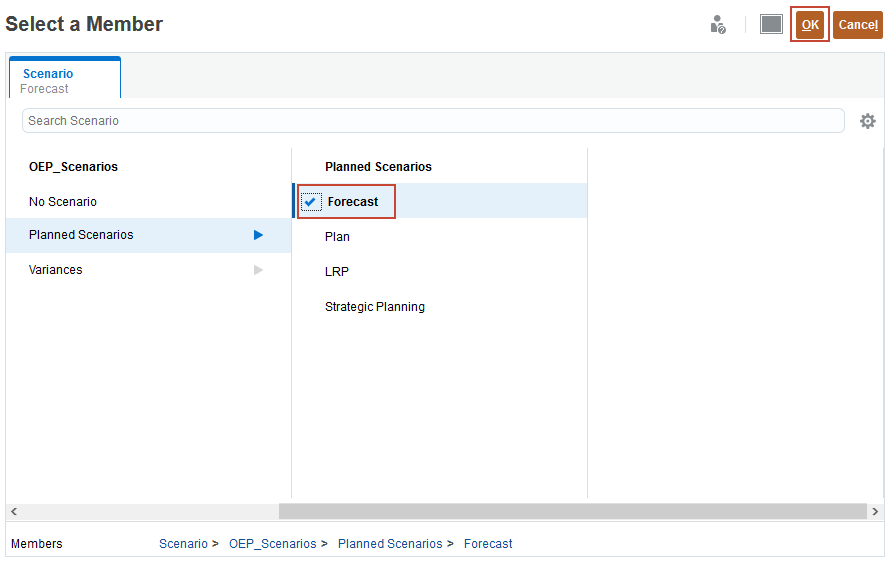
- Click Scenario, select Forecast, and click OK.
- For Product Income Existing Products Key Customers, in Trend Assumptions, select Hold Forecast to Current Year Plan and in %Increase/(Decrease), enter 5%.
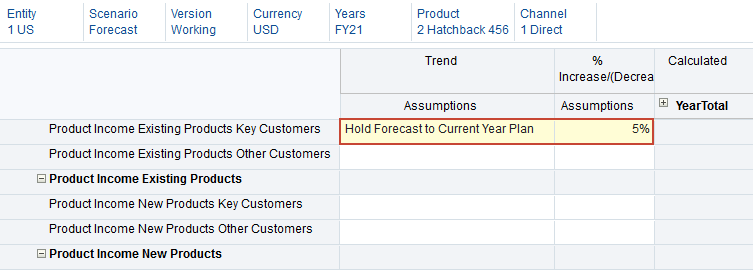
Hold forecast to current year plan is for the Forecast scenario only. It compares how much has been spent year to date for an account to the Plan for the current year, and spreads the remainder evenly over the remaining months in the Forecast. You need to have plan data loaded for the current year.
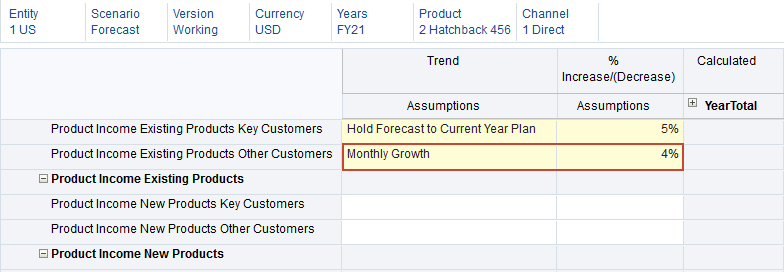
- For Product Income Existing Products Other Customers, in Trend Assumptions, select Monthly Growth, and in %Increase/(Decrease), enter 4%.
Monthly growth calculates year over year change for an account using current year and prior year as the basis to calculate the growth. You need to have data for the prior year, in this case FY20.
- Click Save.
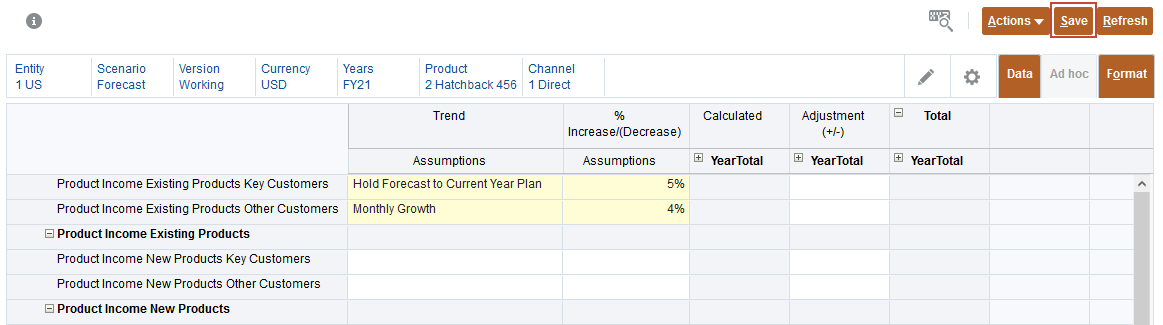
- At the Information message, click OK.
The data is calculated based on the selections.

- Click Years, select FY20, and click OK.
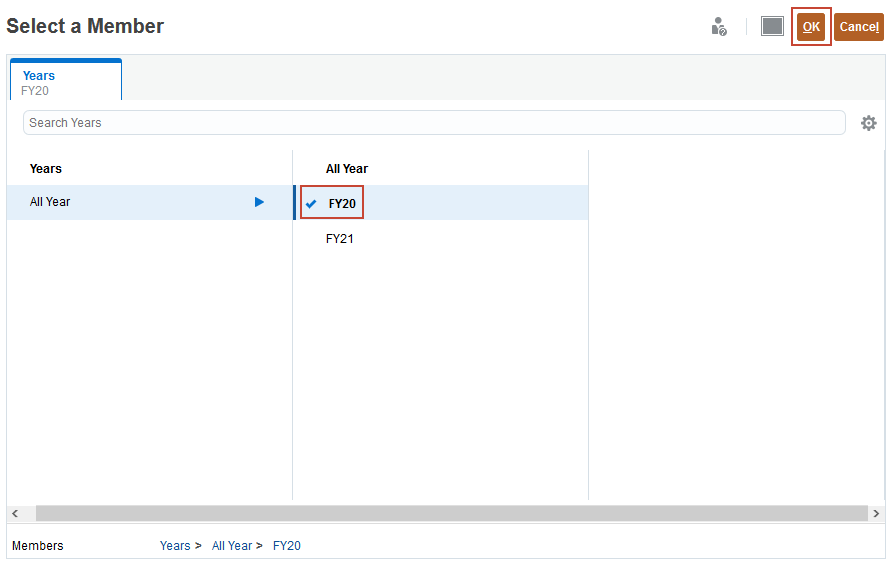
- Click (Go).
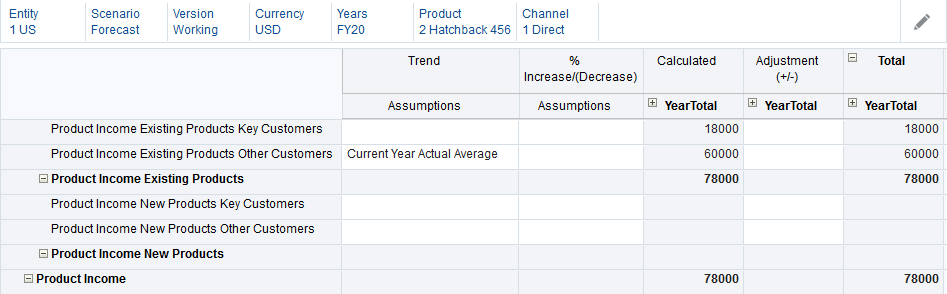
- For Product Income Existing Products Other Customers, in Trend Assumptions, select Current Year Actual Average.
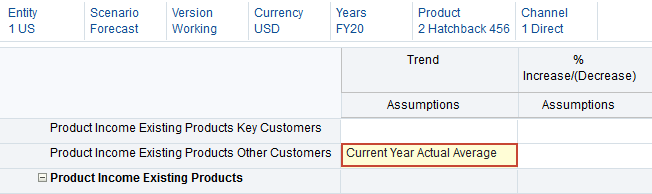
- Click Save, and at the Information message, click OK.
The data is calculated based on the selections.
- Click Years, select FY21, and click OK.
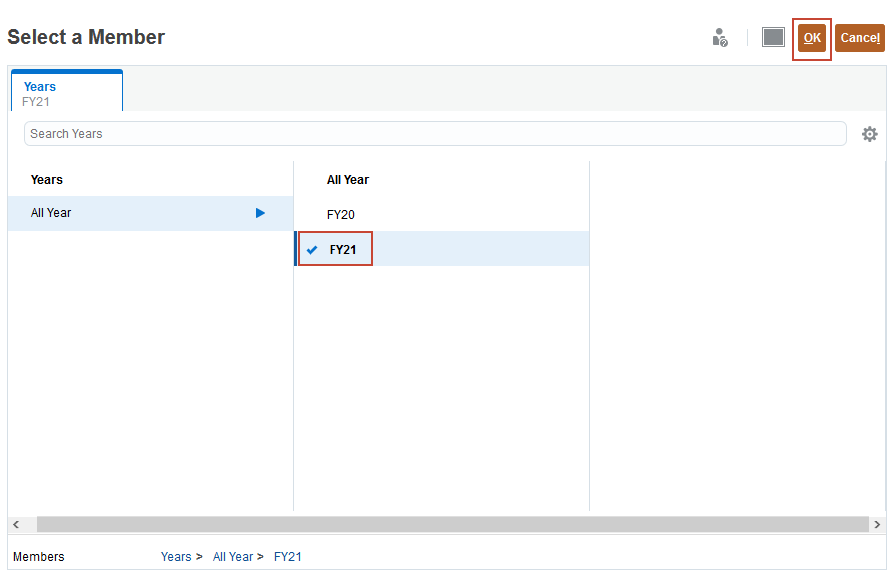
- Click (Go).
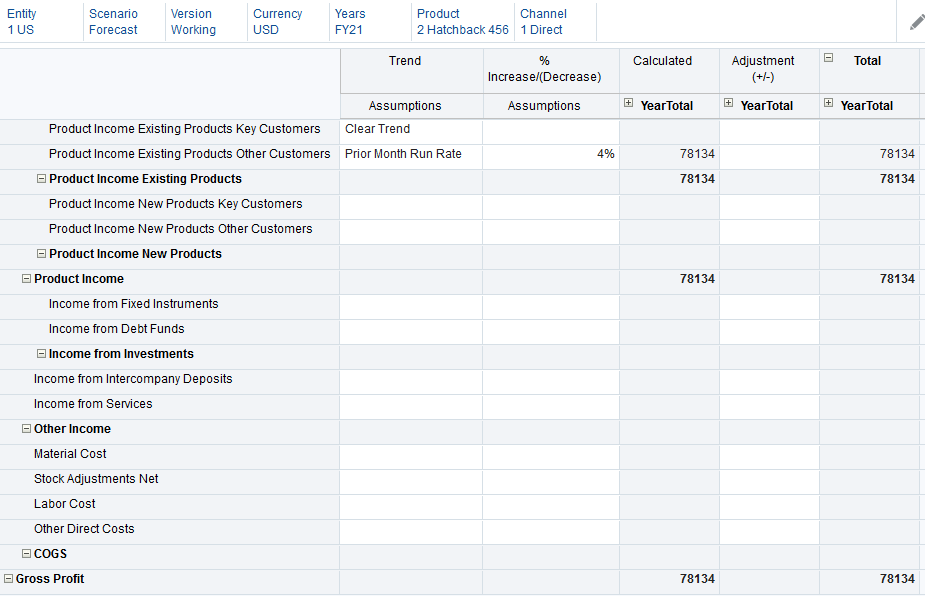
- For Product Income Existing Products Other Customers, in Trend Assumptions, select Prior Month Run Rate, and click Save.
Prior month run rate takes the value of the prior period. The current month is January and the first period for forecast is February, so the January value is applied to February.
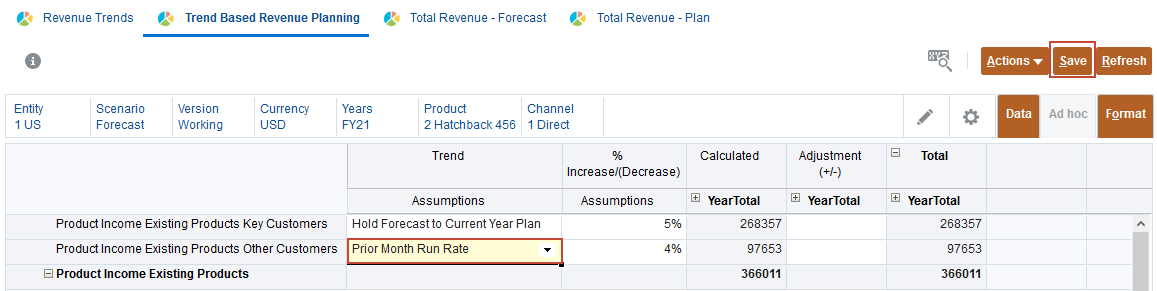
- At the Information message, click OK.
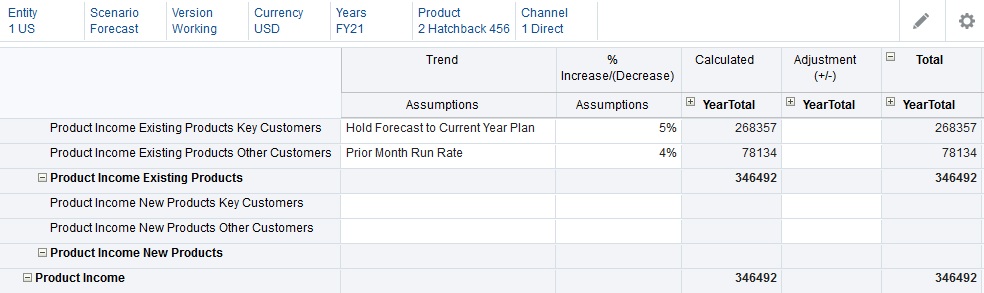
The data is calculated based on the selections.
- For Product Income Existing Products Key Customers, in Trend Assumptions, select Clear Trend, and in %Increase/(Decrease) delete the percentage. Then click Save, and in the Information message, click OK.
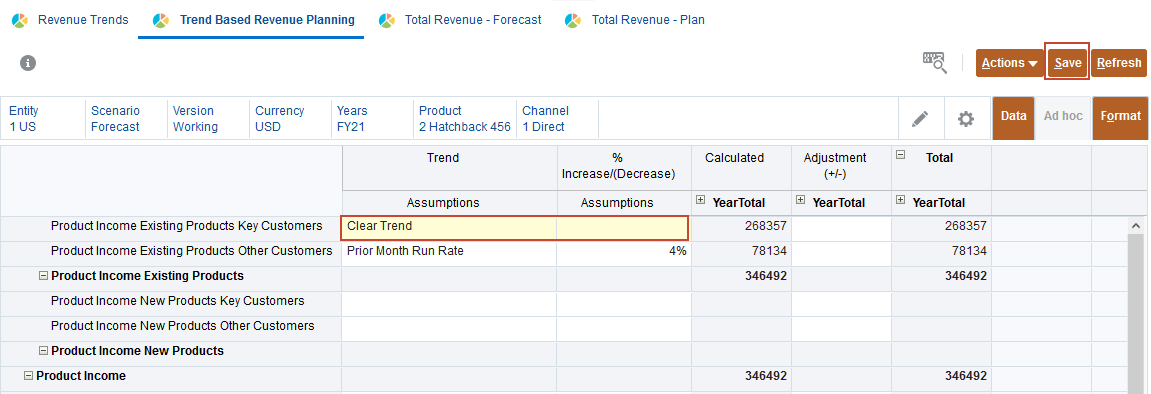
Clear trend removes the trend and clears the data from a previously set trend.
Rolling up data
In this section, we roll up data after planning with trends.
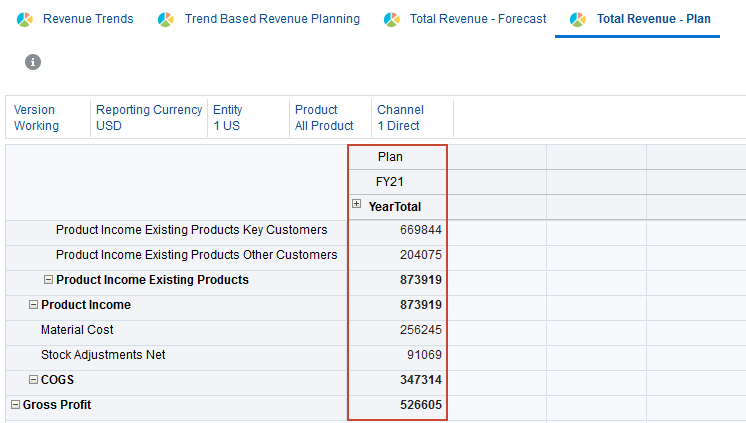
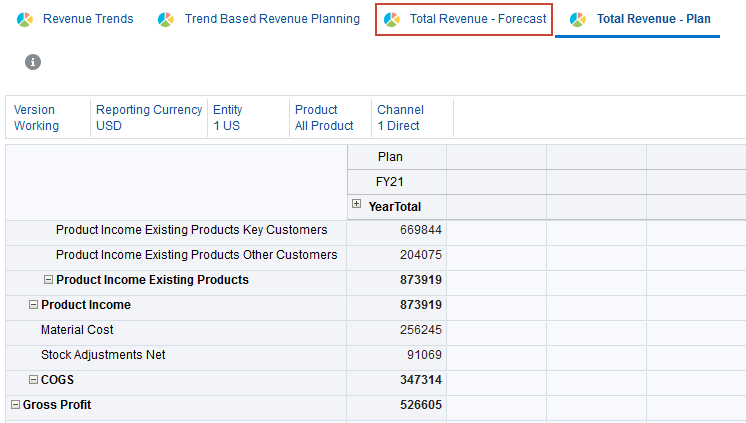
- Click the Total Revenue - Plan horizontal tab.
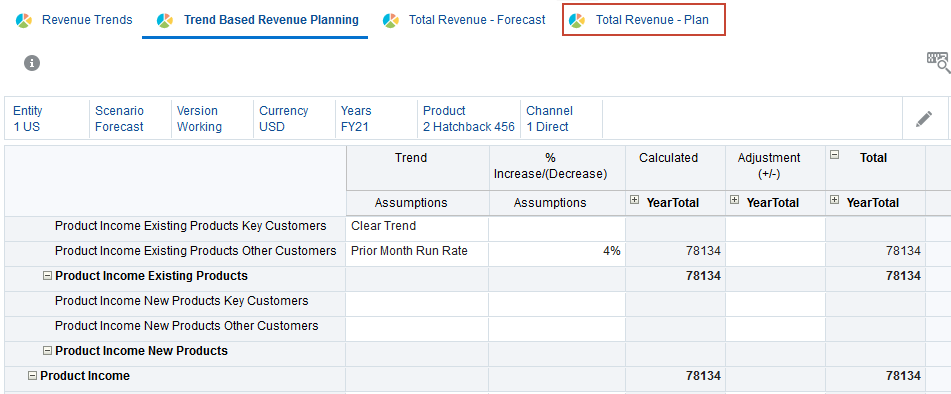
- Click Product, select All Product, and click OK.
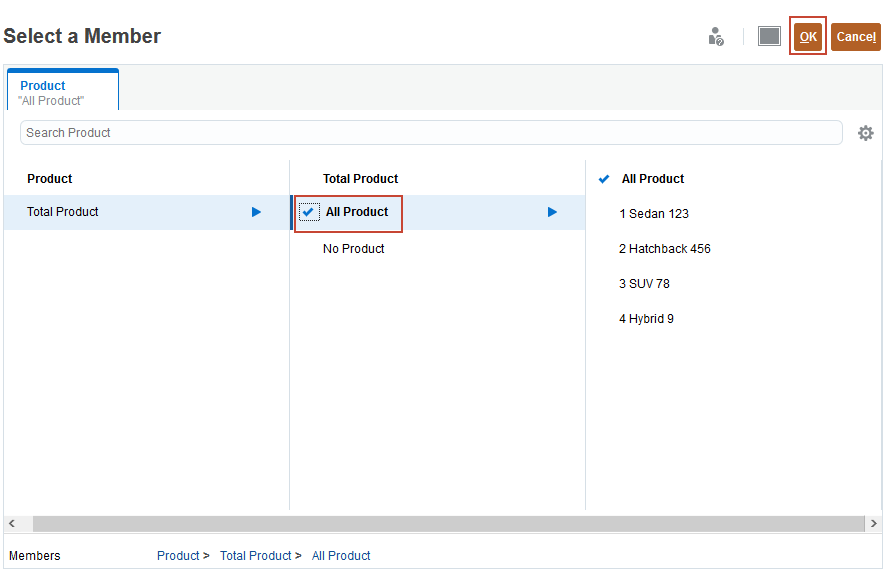
- Click (Go).
- From the Actions menu, select Business Rules.
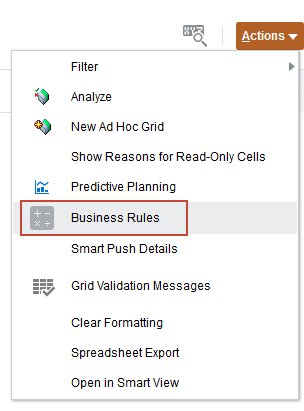
- Select Rollup.
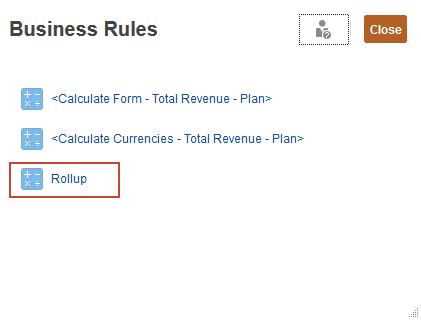
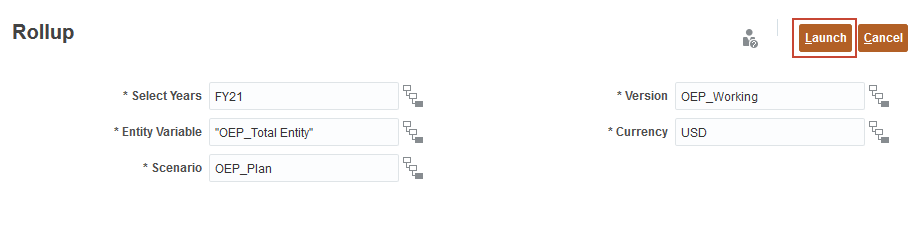
- For each member click (Select Member) to set the value as specified below, then click Launch:
- Years: FY21
- Entity Variable: "OEP_Total Entity"
- Scenario: OEP_Plan
- Version: OEP_Working
- Currency: USD
- At the Information message, click OK.
Plan data is rolled up.
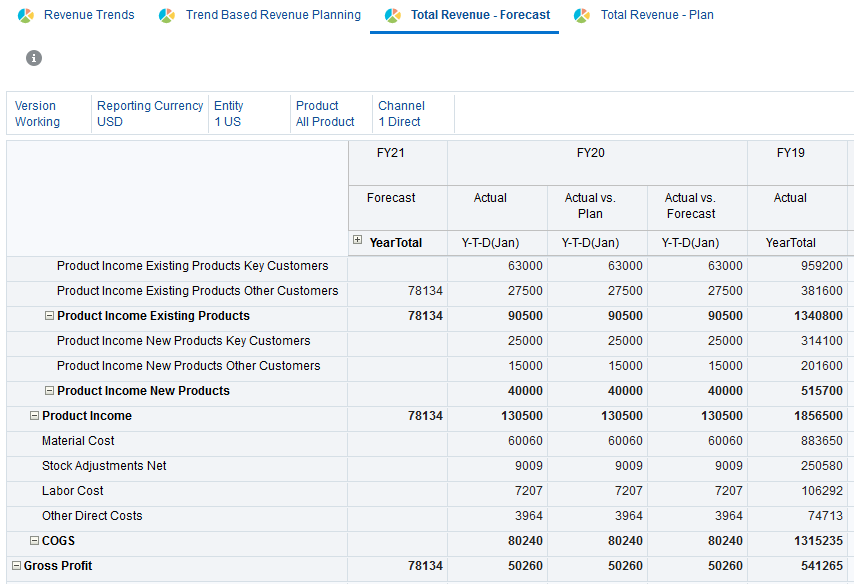
- Click the Total Revenue - Forecast horizontal tab.
- From the Actions menu, select Business Rules.
- Select Rollup.
- For each member click (Select Member) to set the value as specified below, then click Launch:
- Years: FY21
- Entity Variable: "OEP_Total Entity"
- Scenario: OEP_Forecast
- Version: OEP_Working
- Currency: USD
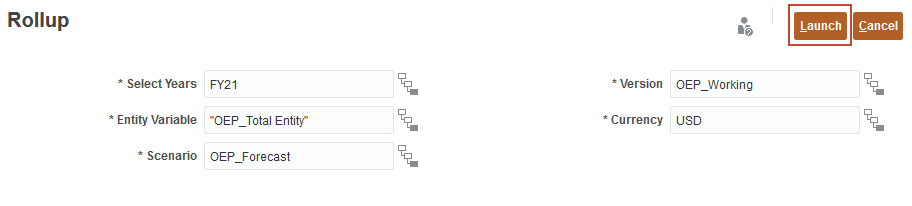
- At the Information message, click OK.
For Forecast, Total Revenue and Gross Profit are calculated for all products.