Oracle® Cloud Creating and Running Notebooks in Oracle Machine
Learning
Before You Begin
This tutorial shows you how to create a notebook and run it in
Oracle Machine Learning. This is the second tutorial in the
series Working with Oracle Machine Learning. Read the tutorials
in sequence.
This tutorial takes approximately 10 minutes to complete.
Background
An Oracle Machine Learning notebook is a web-based interface
for data analysis, data discovery, and data visualization.
Whenever a notebook is created, it must be defined with a
specific Interpreter Settings specification. The notebook
contains an internal list of bindings that determines the order
of the interpreter bindings.
What Do You Need?
Access to your Oracle Machine Learning account
A project created in your Oracle Machine Learning account,
where the notebook will reside
In the Name field, provide a name for the notebook.
In the Comments field, enter comments if any.
The Connection field specifies the Global connection
group.
Click OK. This completes the task of creating a
notebook. You must now open the notebook in the Notebook
editor to set the interpreter bindings.
Click Back to return to the Notebooks page, and to
save the changes in the notebook.
Run
Your Notebook
You must fetch data in a notebook from the data source, and run
the notebook for data analysis and data visualization.
The SQL statements and SQL scripts perform the operations
related to data mining and data analysis in the database. The
notebook offers the functionality to perform charting on the SQL
interpreter output that is returned to the notebook. The options
in the chart settings to perform groupings, summation, and other
operations are done in the notebook server, and not in the
database server. For instance, if you want to run a Group By
on all your data, then it is recommended to use SQL scripts to
do the grouping in the database, and return the summary
information for charting in the notebook. Grouping at the
notebook level works well for small sets of data. If you pull a
lot of data into the notebook, then there is a chance of the JVM
running out of memory. You can set the row limit for your
notebook by using the option Render Row Limit in the
Connection Group page.
To run a notebook:
Click the notebook that you want to run. The notebook opens
in the Notebook editor.
Type the SQL statement to fetch data from an Oracle
Database. For example, type SELECT * from SH.SALES; where
SH is the schema name and SALES is
the table name as shown in the screenshot.
Description
of the illustration sh_sales.png
Click .
Alternatively, you can press Shift+Enter keys to run the
notebook.
After you run the notebook, it fetches the data in the
notebook in the next paragraph, as shown in the screenshot. A
paragraph is a notebook component where you can write SQL
statements and run scripts. A paragraph has an input section
and an output section. In the input section, you specify the
interpreter to run along with the text. This information is
sent to the interpreter to be executed. In the output section,
the results of the interpreter are provided.
Description
of the illustration sh_sales_data.png
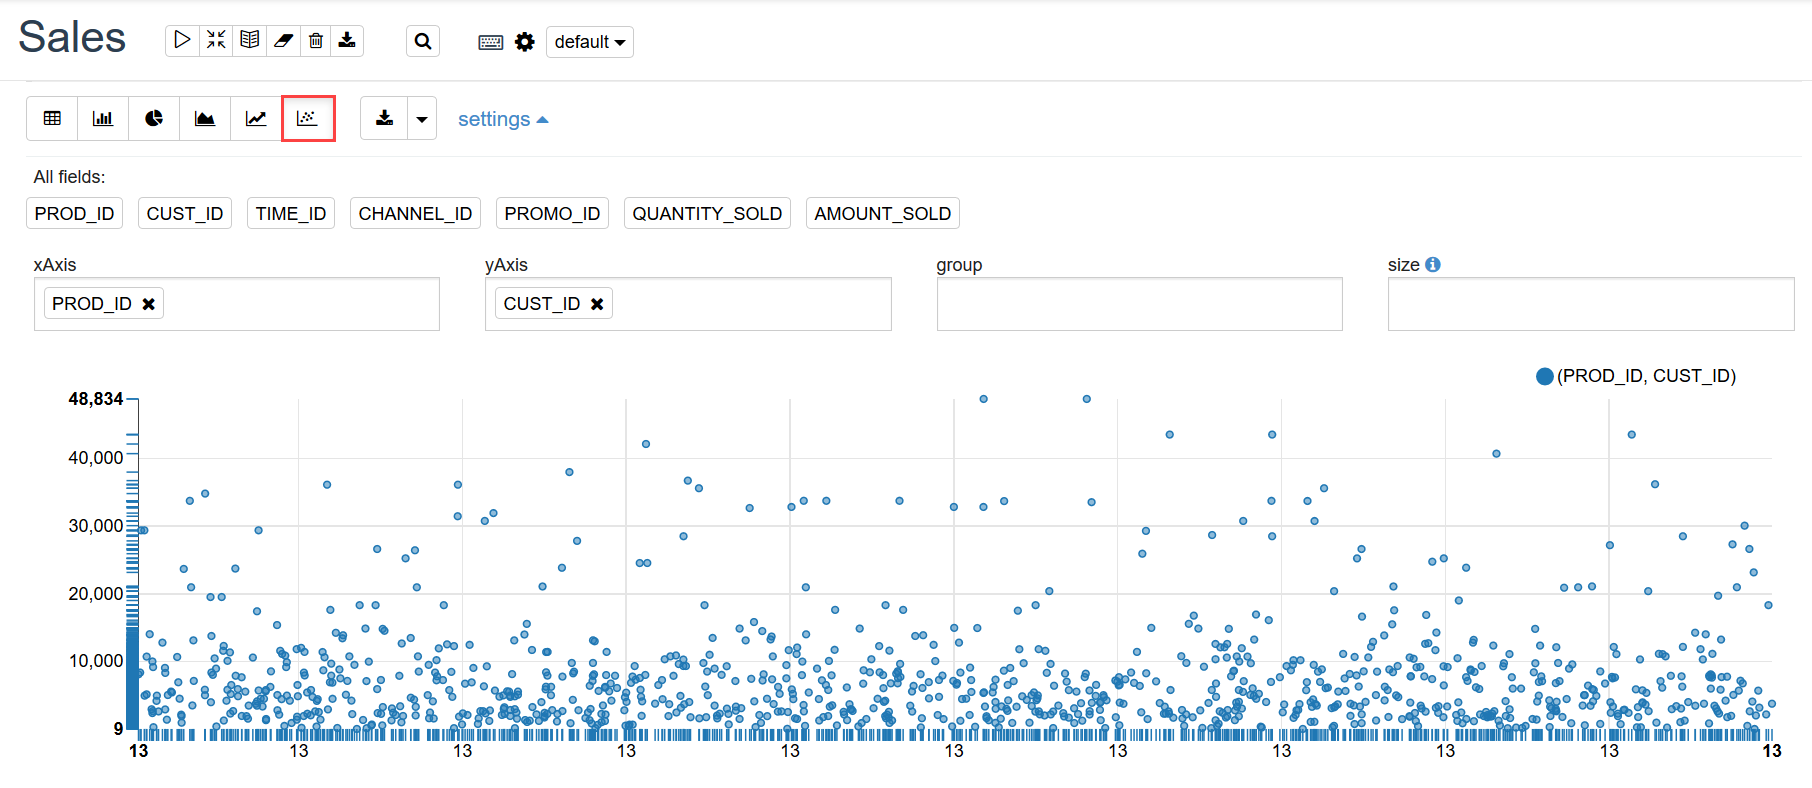
The output section of the paragraph has a charting component
that displays the results in graphical output. The chart
interface allows you to interact with the output in the
notebook paragraph. You have the option to run and edit single
a paragraph or all paragraphs in a notebook. In this
screenshot, you can see the data from the SALES
table in a scatter plot.
Description
of the illustration sh_sales_scatter plot.png
You can visualize the data by clicking the respective icons
for each graphical representation, as shown here:
Click the histogram icon
to visualize your data in a histogram.
Click the pie chart icon
to visualize your data in a pie chart.
Click the cumulative gain chart icon to visualize your data
in a cumulative gain chart.
Click the line diagram icon to visualize your data in a line
diagram.
Click the scatter plot icon to visualize your data in a
scatter plot.
 Oracle® Cloud Creating and Running Notebooks in Oracle Machine
Learning
Oracle® Cloud Creating and Running Notebooks in Oracle Machine
Learning Before You Begin
 Create
Your Notebook
Create
Your Notebook

 Run
Your Notebook
Run
Your Notebook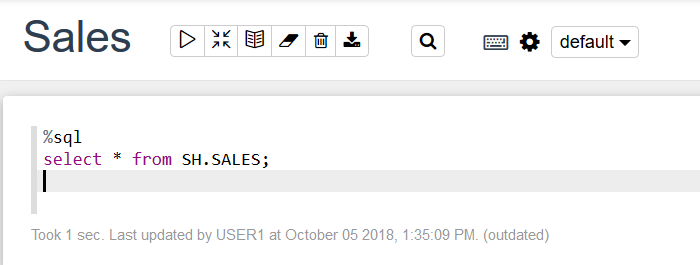
 .
Alternatively, you can press Shift+Enter keys to run the
notebook.
.
Alternatively, you can press Shift+Enter keys to run the
notebook. 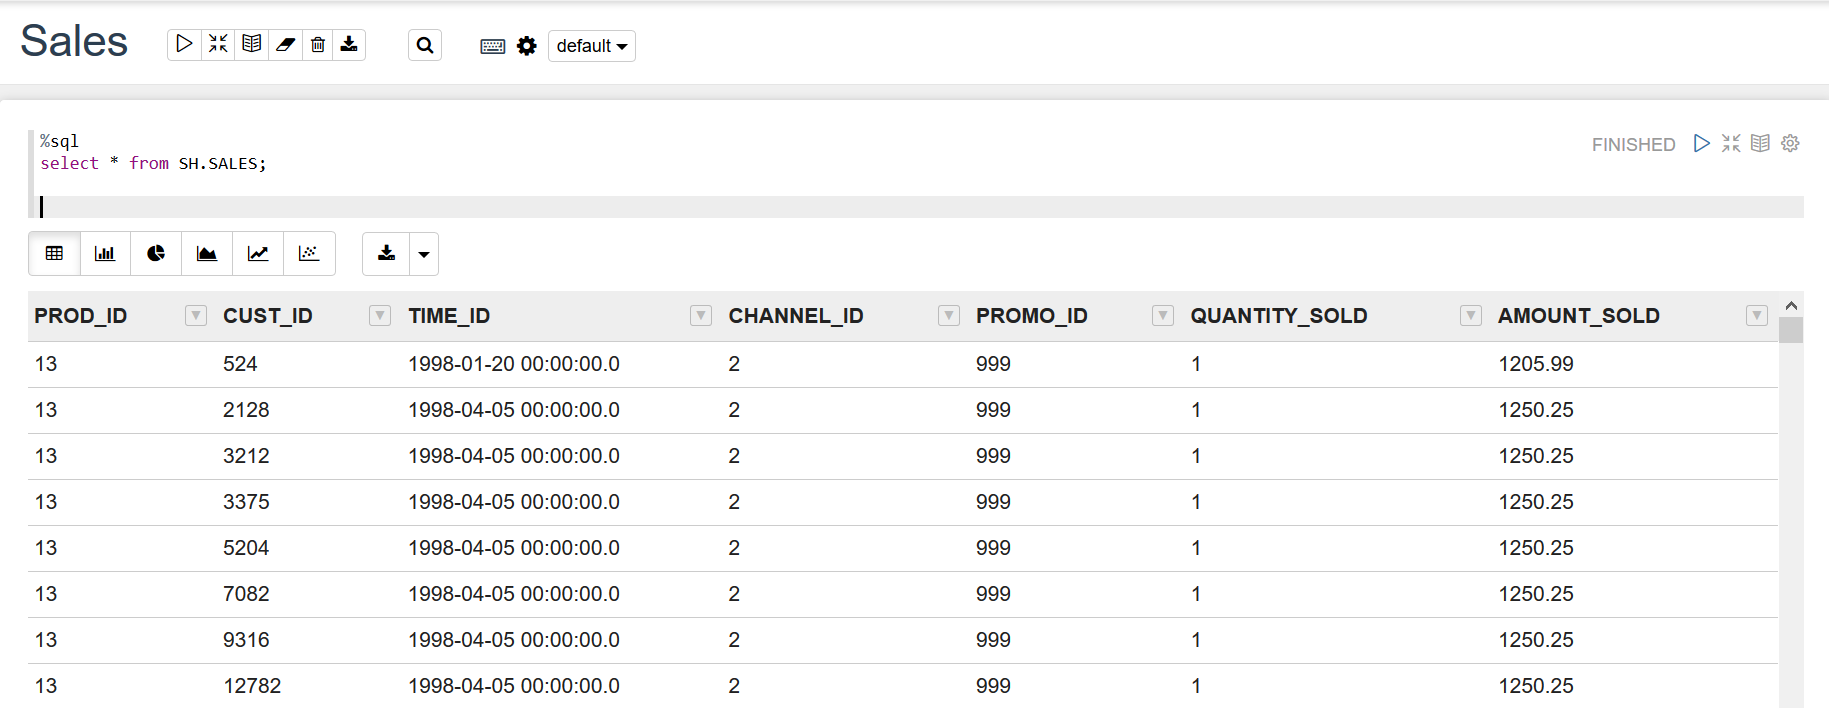
 to visualize your data in a histogram.
 to visualize your data in a pie chart.
 to visualize your data
in a cumulative gain chart.
to visualize your data
in a cumulative gain chart. to visualize your data in a line
diagram.
to visualize your data in a line
diagram. to visualize your data in a
scatter plot.
to visualize your data in a
scatter plot.