
This document will continue to evolve as existing sections change and new information is added. All updates appear in the following table:
| Date | Product | Feature | Notes |
|---|---|---|---|
| 02 DEC 2021 | Created initial document. |
Oracle Utilities Opower provides a range of data-driven solutions, software products, and personalized insights to utility customers about their energy use.
This guide outlines the information you need to know about new or improved functionality in this update, and describes any tasks you might need to perform for the update. Each section includes a brief description of the feature, the steps you need to take to enable or begin using the feature, any tips or considerations that you should keep in mind, and the resources available to help you.
DISCLAIMER
The information contained in this document may include statements about Oracle’s product development plans. Many factors can materially affect Oracle’s product development plans and the nature and timing of future product releases. Accordingly, this Information is provided to you solely for information only, is not a commitment to deliver any material, code, or functionality, and should not be relied upon in making purchasing decisions. The development, release, and timing of any features or functionality described remains at the sole discretion of Oracle.
This information may not be incorporated into any contractual agreement with Oracle or its subsidiaries or affiliates. Oracle specifically disclaims any liability with respect to this information. Refer to the Legal Notices and Terms of Use for further information.
Column Definitions:
Report = New or modified, Oracle-delivered, ready to run reports.
UI or Process-Based: Small Scale = These UI or process-based features are typically comprised of minor field, validation, or program changes. Therefore, the potential impact to users is minimal.
UI or Process-Based: Larger Scale* = These UI or process-based features have more complex designs. Therefore, the potential impact to users is higher.
Features Delivered Disabled = Action is needed BEFORE these features can be used by END USERS. These features are delivered disabled and you choose if and when to enable them. For example, a) new or expanded BI subject areas need to first be incorporated into reports, b) Integration is required to utilize new web services, or c) features must be assigned to user roles before they can be accessed.
| Ready for Use by End Users Reports plus Small Scale UI or Process-Based new features will have minimal user impact after an update. Therefore, customer acceptance testing should focus on the Larger Scale UI or Process-Based* new features. |
Customer Must Take Action before Use by End Users Not disruptive as action is required to make these features ready to use. As you selectively choose to leverage, you set your test and roll out timing. |
|||||
|---|---|---|---|---|---|---|
| Feature |
Report |
UI or |
UI or |
|
||
Limited Income Reports for Email Home Energy Reports v3
The Limited Income Report educates limited income customers on ways to be more energy efficient and presents opportunities for them to reduce their immediate and future bills. The report has several unique features, including:
- Welcome Module: Provides tailored welcome messaging for limited income customers that alerts them to energy efficiency and assistance programs that could help reduce their bills.
- What Uses Most: Highlights a customer's top energy usage categories, paired with a free or low-cost tip action that the customer can take to reduce energy use in those categories. It also provides information about the customer's other top energy use categories so that they have a full picture of how they are using energy.
- Tips: Highlights free or low-cost tips, based on disaggregation data, that are relevant to the limited income customer’s home.

The Limited Income Report helps utilities to drive equitable decarbonization and increase awareness of opportunities to save for limited income customers.
Steps to Enable
Contact your Service Delivery Manager to coordinate configuration of the module.
To contact your Service Delivery Manager:
- Log in to Inside Opower (https://inside.opower.com). This is your portal for questions and information related to your program.
- Go to the Community tab and contact the Service Delivery Manager using the information provided.
Key Resources
- Refer to the Limited Income Reports training.
- Refer to Email Home Energy Reports v3 Overview for more information.
- Refer to Email Home Energy Reports v3 Configuration Guide for more information.
Winter Seasonal Report for Email Home Energy Reports v3
The Winter Seasonal Report educates customers about their heating costs and encourages them to reduce their energy use leading up to winter weather conditions. The reports are sent before the start of the winter season to help the customer plan for the season ahead. The report has several unique features, including:
- Seasonal Breakout: Informs the customer what percentage of their energy use the previous winter went toward heating.
- Seasonal Normative Comparison: Displays the customer’s aggregated total energy use from the previous winter season compared to either similar homes or homes in the efficiency zone to create a realistic savings goals for the customer.
- Thermostat Adjustment: Recommends a thermostat adjustment for the season, and creates trust by including a citation to a credible source, such as the U.S. Department of Energy.
- Seasonal Tips: Provides tips designed to help customers lower their winter heating usage.
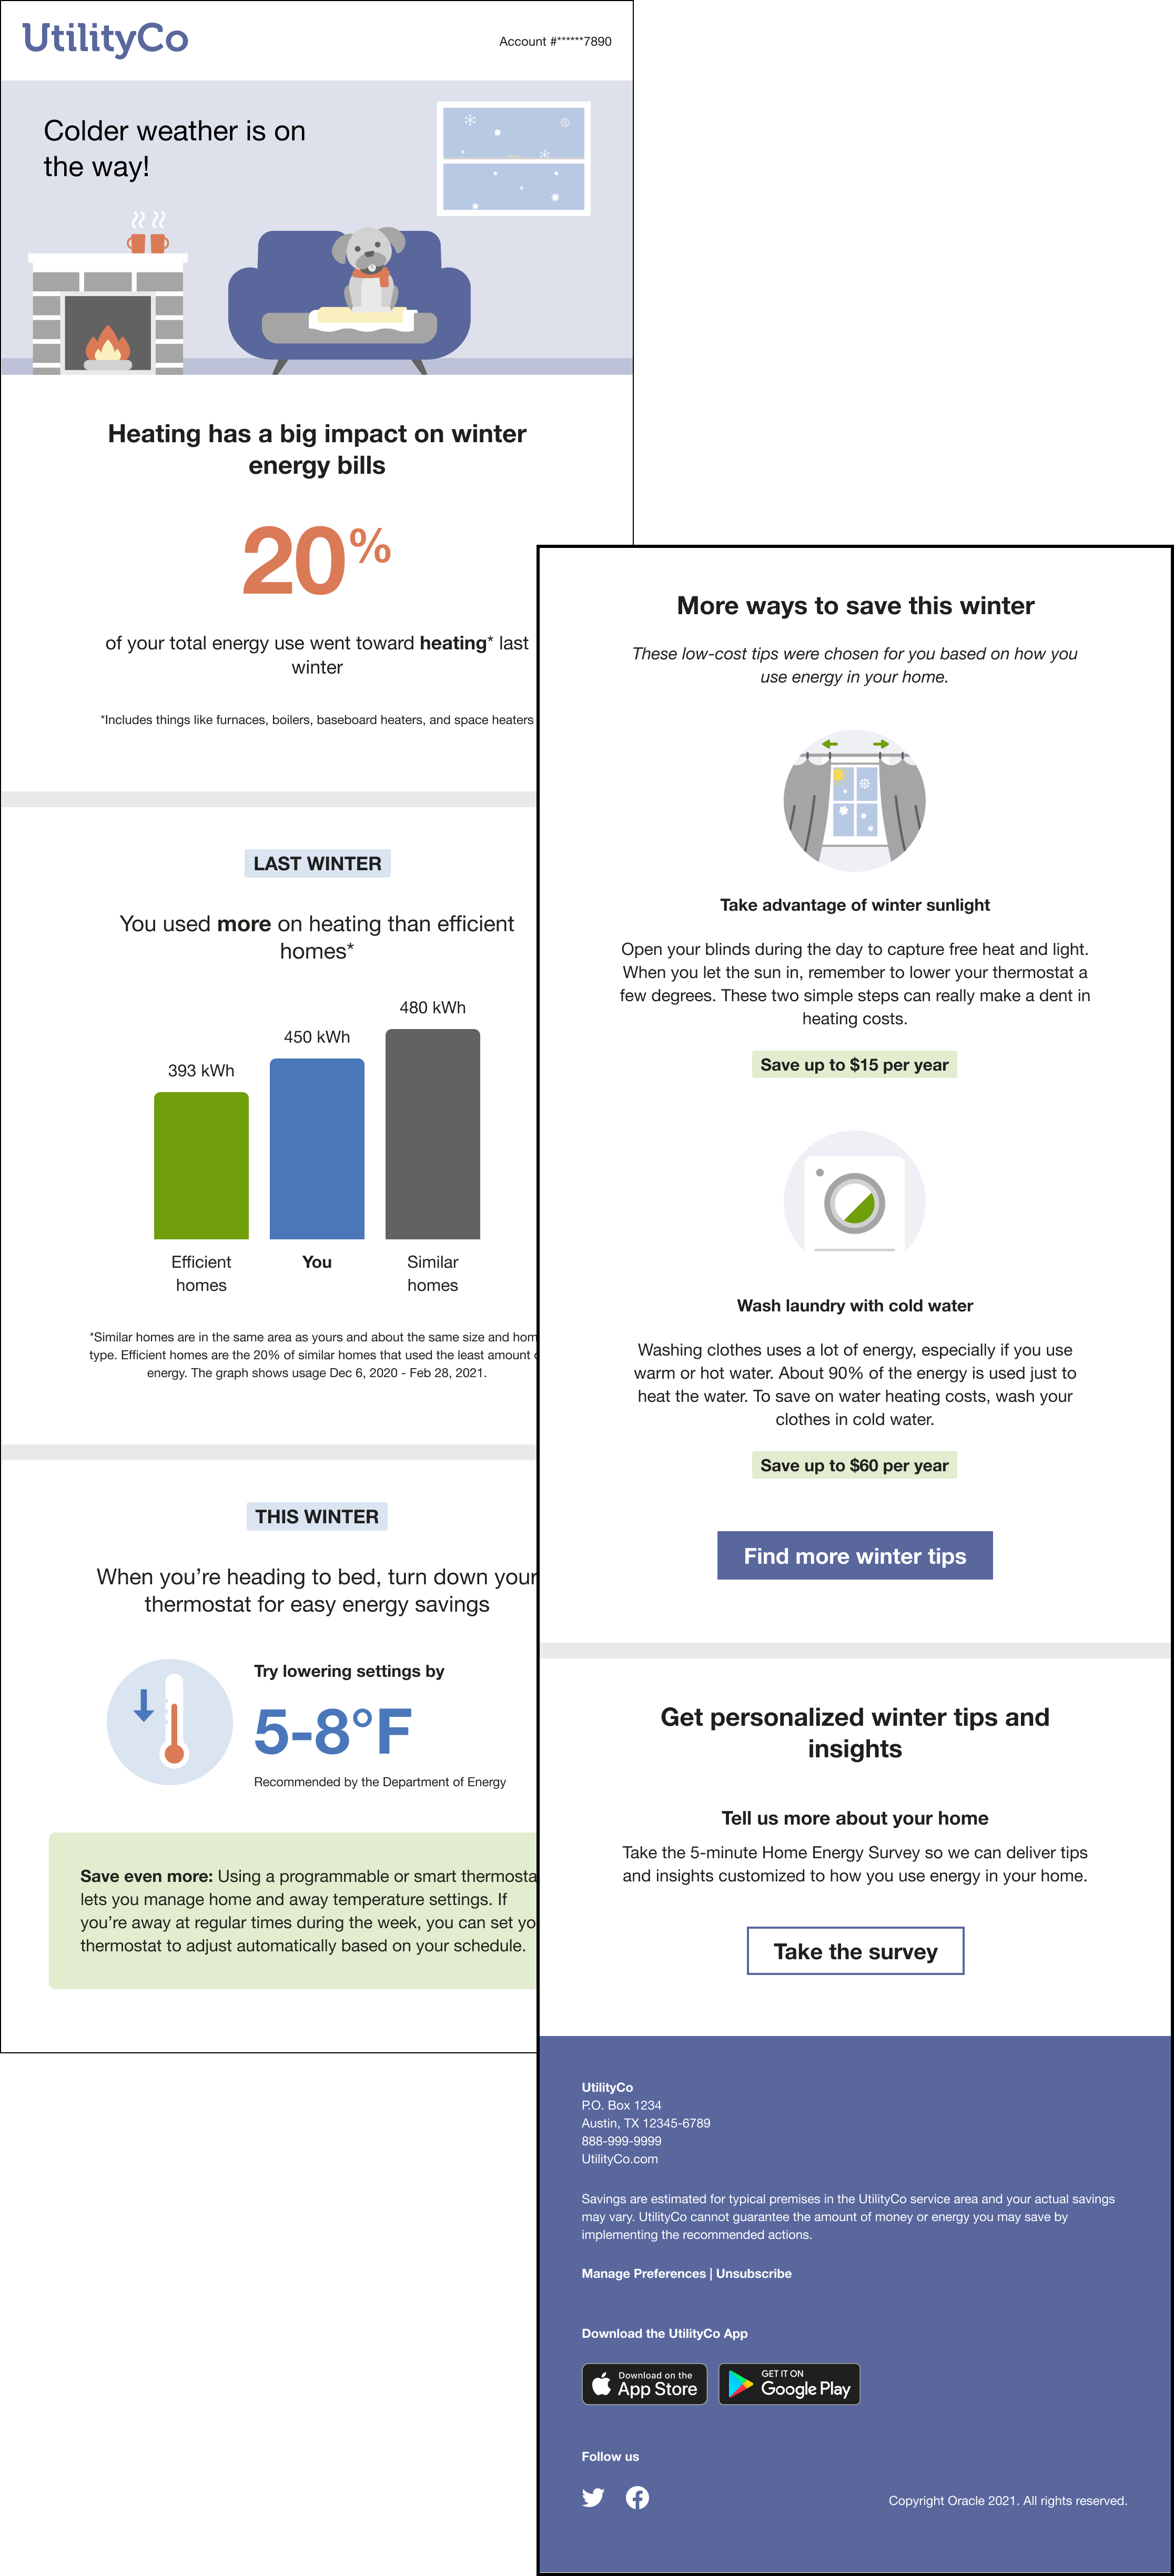
Utilities can use the Winter Seasonal Report to motivate customers to reduce their energy use in the lead up to the winter weather season.
Steps to Enable
Contact your Service Delivery Manager to coordinate configuration of the module.
To contact your Service Delivery Manager:
- Log in to Inside Opower (https://inside.opower.com). This is your portal for questions and information related to your program.
- Go to the Community tab and contact the Service Delivery Manager using the information provided.
Key Resources
- Refer to the Seasonal Reports training.
- Refer to Email Home Energy Reports v3 Overview for more information.
- Refer to Email Home Energy Reports v3 Configuration Guide for more information.
Limited Income Reports for Home Energy Reports v3
The Limited Income Report educates limited income customers on ways to be more energy efficient and presents opportunities for them to reduce their immediate and future bills. The report has several unique features, including:
- Welcome Module: Provides tailored welcome messaging for limited income customers that alerts them to energy efficiency and assistance programs that could help reduce their bills.
- What Uses Most: Highlights a customer's top energy usage categories, paired with a free or low-cost tip action that the customer can take to reduce energy use in those categories. It also provides information about the customer's other top energy use categories so that they have a full picture of how they are using energy.
- Tips: Highlights free or low-cost tips, based on disaggregation data, that are relevant to the limited income customer’s home.

The Limited Income Report helps utilities to drive equitable decarbonization and increase awareness of opportunities to save for limited income customers.
Steps to Enable
Contact your Service Delivery Manager to coordinate configuration of the module.
To contact your Service Delivery Manager:
- Log in to Inside Opower (https://inside.opower.com). This is your portal for questions and information related to your program.
- Go to the Community tab and contact the Service Delivery Manager using the information provided.
Tips And Considerations
- Refer to the Limited Income Reports training.
- Refer to Home Energy Reports v3 Overview for more information.
- Refer to Home Energy Reports v3 Configuration Guide for more information.
Winter Seasonal Report for Home Energy Reports v3
The Winter Seasonal Report educates customers about their heating costs and encourages them to reduce their energy use leading up to winter weather conditions. The reports are sent before the start of the winter season to help the customer plan for the season ahead. The report has several unique features, including:
- Seasonal Breakout: Informs the customer what percentage of their energy use the previous winter went toward heating.
- Seasonal Normative Comparison: Displays the customer’s aggregated total energy use from the previous winter season compared to either similar homes or homes in the efficiency zone to create a realistic savings goals for the customer.
- Thermostat Adjustment: Recommends a thermostat adjustment for the season, and creates trust by including a citation to a credible source, such as the U.S. Department of Energy.
- Seasonal Tips: Provides tips designed to help customers lower their winter heating usage.

Utilities can use the Winter Seasonal Report to motivate customers to reduce their energy use in the lead up to the winter weather season.
Steps to Enable
Contact your Service Delivery Manager to coordinate configuration of the module.
To contact your Service Delivery Manager:
- Log in to Inside Opower (https://inside.opower.com). This is your portal for questions and information related to your program.
- Go to the Community tab and contact the Service Delivery Manager using the information provided.
Key Resources
- Refer to the Seasonal Reports training.
- Refer to Home Energy Reports v3 Overview for more information.
- Refer to Home Energy Reports v3 Configuration Guide for more information.
High Usage Analytics in Opower Analytics Visualization
The usage attribute in Opower Analytics Visualization was increased to a max of >1,500 kWh per day under the Average Daily Electric attribute options. Utilities can use usage attributes to explore customer usage data and pinpoint usage outliers. The >1,500 kWh per day attribute allows utilities to more easily identify customers who are likely to have a high bill, and use that information to enhance program targeting. Previously, the highest usage attribute was >50 kWh per day.
The increased usage attribute maximum allows utilities to better understand the energy usage of their customers and the load on their grid and enhance program targeting.
Steps to Enable
You don't need to do anything to enable this feature.
Key Resources
- Refer to Opower Analytics Visualization for more information.
Savings Dashboards in Opower Analytics Visualization
Energy efficiency program data is available in the Opower Analytics Visualization Savings Dashboards. Utilities can use the dashboards to view electric savings by wave, percent of electric savings by wave, gas savings by wave, percent of gas savings by wave, and monthly gas and electric savings. Previously these dashboards were only available through Oracle Utilities Inside Opower.

This feature improves the utility self-service experience by making information about program energy savings more accessible.
Steps to Enable
You don't need to do anything to enable this feature.
Key Resources
- Refer to Opower Analytics Visualization for more information.