Visualize
Data visualization is a fundamental component of every analytics system. Without visualizations, it is difficult to quickly consume dense information or large data sets. Highly visual, interactive analytics dashboards provide graphics to explore relationships between variables, identify patterns, trends, outliers, and variances. Oracle Analytics provides an easy-to-use, click-and-drag interface that allows any user to blend data sets, explore their data, and construct visual stories for stakeholders—without the need for separate tools.
Self-service data visualization
Instantly visualize data, jump-starting the analytics process. Natural language processing powers text and speech for conversational search and analysis; simply ask a question and get a visual answer. Build compelling visual stories with automated chart and graph recommendations. Get started quickly with more than 45 out-of-the-box visualizations, including Waterfall Bridge Reports, Spark Charts on Performance Tiles, Heat Map Layers, and custom image maps. Create custom, interactive visuals from any image through geospatial analysis with built-in and custom map layers. Tell a more complete data story with composite visualizations that display multiple related metrics in one view. Upload images and create map layers with custom areas and no-code shape definitions that are bound to the data.

Governed reports and dashboards
Build and centrally manage reports and interactive dashboards to help ensure governance and control. Create static reports or fully interactive parameterized dashboards with functions such as drill down and filtering. Ensure business users access certified reports from verified data sources that leverage approved metrics, calculations, and KPIs. Update once to ensure everyone uses the correct version of the data. Schedule reports to automatically refresh and notify business users. When authorized, users can print, share, and save reports or export the base data. Integration with wider services allows users to act on information directly from the report.


AI-generated newscasts
Present data stories in a familiar news broadcast format that engages stakeholders more effectively. Using the Story Exchange Format, Oracle Analytics integrates with partner services, such as Synthesia, enabling you to transform dashboards and reports into dynamic visual presentations using AI avatars.
Pixel-perfect, high-volume reporting
Oracle Analytics includes Oracle Analytics Publisher (also called Oracle Business Intelligence Publisher), which provides high-volume reporting capabilities from any data set or semantic model. Author, manage, and deliver highly formatted, pixel-perfect documents, such as operational reports, electronic funds transfer documents, government PDF forms, shipping labels, checks, sales and marketing letters, and more.
Composite visualizations
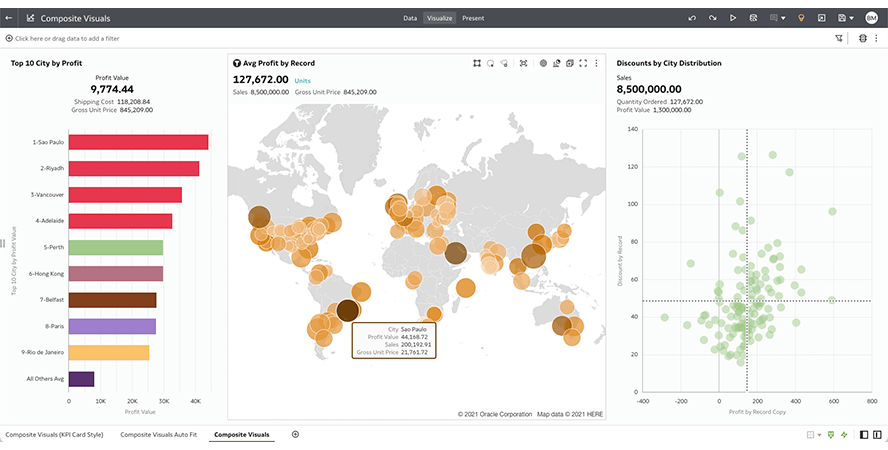
Composite visualizations are designed to provide more comprehensive and intuitive insights into data by visualizing additional metrics and dimensions more densely in a single visualization object. These visualizations are created by combining multiple visuals, such as bar charts and line graphs, in one chart. This allows you to better understand the data, identify correlations, and spot trends—all using a single visual. Composite visualizations can help you not only identify correlations between different sets of data but also uncover trends and patterns that may otherwise be overlooked. This can help inform business decisions and increase efficiency.

Performance monitoring
With developer mode, analysts and developers can monitor the performance of individual visualizations or a complete canvas. This allows them to find any objects that are underperforming, identify any issues, and correct them. Developers can examine logical SQL created for analyses, observe which queries are generated, and see the execution log.

Use developer mode to obtain the HTML embed code and place any of the live visualization objects into other web pages.
Conditional formatting
Set conditional formatting rules for reports, visualizations, tables, and pivot tables. Rules can be applied to a specific chart, all charts on a page, or a specific metric. Use the sophisticated rules engine to express complex formatting logic.

Custom visualizations
Oracle Analytics includes more than 45 different built-in visualization types. For any cases that require unique or specialized visuals, the prebuilt visualization library can be easily extended with D3 graphics. Either choose from Oracle Analytics’ extensions library or your favorite source for D3 graphics, like GitHub.